How To Do Endpoint Monitoring on a Shoestring Budget – Webcast Write-Up
Joff Thyer & Derek Banks //
Editor’s Note: This is a more in-depth write-up based on the webcast which can be watched here.
As penetration testers, we often find ourselves in the position of making recommendations for “increasing visibility for endpoints” with respect to event logging. We usually feel great about this, because it is without a doubt, a sound recommendation founded on good evidence.
What evidence do you ask? When we’re penetration testing, we have specific patterns of behavior that leave a trail of evidence; however, this evidence is rarely found on central servers. Most of the action is occurring at the edge of your environment, and it’s not until late into an intrusion that anything might be centrally logged.
Typically in an engagement, we’ll social engineer users to run custom malware. This might happen by means of a website, removable media, or email delivery vehicle which will get a user to perform an action on an end station. This malware will handily evade endpoint protections, and will in almost all cases create an outbound command and control (C2) channel. Our next typical move is to escalate privileges, start laterally moving in your environment, possibly pillaging data mercilessly in the process! As part of escalation, we might use a password spraying technique or exploit some other software vulnerability. These patterns of behavior can leave some logging evidence on central servers but the vast majority of the evidence will be left in the endpoint event logs. Actual attackers using their specific tools, techniques, and procedures would leave a similar trail of activity on endpoints as well.
Like a pen tester, attackers rely on the fact that usually, no one is watching what’s happening inside an environment and that most prevention and detection methods are implemented at the ingress/egress of a network. If they can get past those, they’ll likely not be detected for some time. Endpoint monitoring, specifically Windows endpoints at the edge of your network, is crucial to find an attacker that has made it past upstream network-based solutions.
Almost all of our customers respond to this recommendation with a counter-question with something like: “Hey [BHIS Tester], we have thousands of endpoints. How can I possibly gather logs across all of them and be able to hunt for threat actors?” Fair question!
While the SIEM vendors would absolutely LOVE for you to create a giant fire hose of event data, we all know that this approach neither scales financially or operationally. So can we generate endpoint event logging that focuses on the right things, and doesn’t cost us our arms and legs?
One option, if you’re game, is to grow your own solution that can be tuned and scaled appropriately. There are several useful solutions (both open source and paid) that can address this challenge and can be intelligently configured so that they can be scales out. Here are a list of components we’ll consider which we also discussed in a recent webcast.
- NXLOG: an open-source, and commercial log management solution for multiple platforms including Windows, and Linux.
- SysInternals Sysmon: an excellent Windows event log enhancement module written by Mark Russinovich at Microsoft.
- Elasticsearch: a highly scalable open-source analytics data storage and search solution.
- Kibana: a companion web interface to Elasticsearch that is able to generate direct search queries, and put together data visualizations.
- Logstash: A scalable log ingestion engine that can easily forward its output to Elasticsearch.
It’s important to stress that the key to creating a scalable solution is to distribute the event log filtering configuration so that only the absolute minimum and necessary information flows back to Logstash and subsequently into Elasticsearch.
Also realize that purpose here is to create a proof-of-concept for a tactical monitoring solution geared for monitoring and IR teams, not a compliance and long-term log archive system.
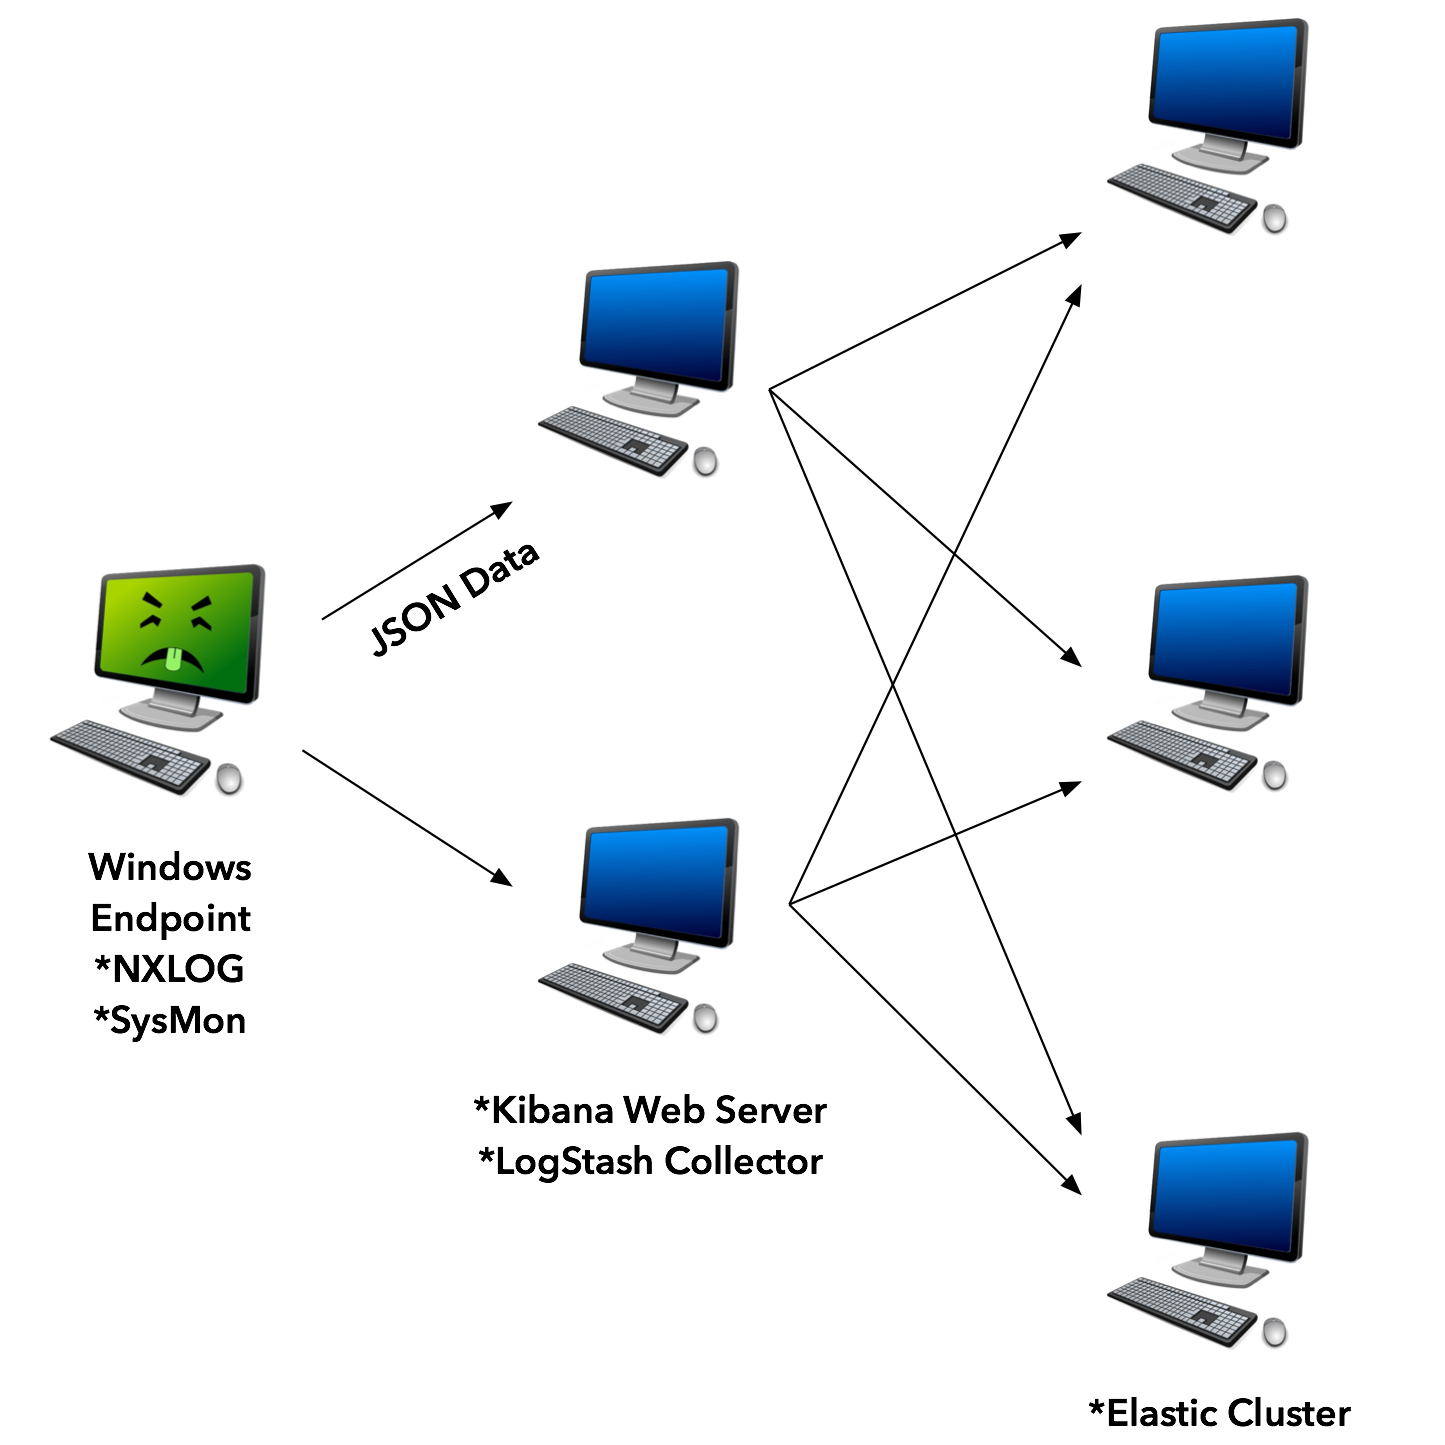
While it is possible to scale up a solution using multiple collectors for logging, and multiple elastic servers, in the proof-of-concept used for this blog, the Elastic, Logstash, and Kibana components (ELK stack) were all installed on a single system for simplicity.
First, we need to get Sysmon running on our Windows endpoints. Next, we will configure PowerShell logging on our endpoints. Then we will configure NXLOG to send the Sysmon logs as well as specifically targeted events to the Elastic Stack solution. This will all be configured through Group Policy Objects (GPO), but you may want to deploy differently in your environment (as always, consult your friendly local system administrator).
Sysmon Configuration
Microsoft’s Sysmon is a tool released as part of the Sysinternals Suite. It extends the endpoint’s logging capability beyond the standard event logs. Some of the key events that it logs are:
- Process creation with full command line and parent process
- Hash of executed process
- Network Connections
- File creation time changes
On the local system, it stores these logs in Event Viewer in Application and Services Logs>Microsoft>Windows>Sysmon>Operational. By default, Sysmon logging will create a fair amount of log noise. This is why a configuration file should be used at install time to filter events at the endpoint that are known to be good or alert on specifically known bad. This way, you’ll won’t be shipping a bunch of noise to the central logging system.
We recommend that you start with the excellent @SwiftOnSecurity configuration file that can be found at their Github page. From there, you can add to the file what you need to further reduce noise in your environment.
To install from the command line (with administrator rights):
sysmon.exe -accepteula -i sysmonconfig-export.xml
The configuration can be updated in a similar manner:
sysmon.exe -c sysmonconfig-export.xml
PowerShell Logging
It’s not just pen testers that are increasingly using PowerShell in their bag of tricks – actual attackers are too. It’s a powerful environment that can accomplish tasks in every phase of an attack from injecting shellcode into memory to post-exploitation situational awareness and lateral movement. In most environments, PowerShell execution with the version delivered with Windows 7 (version 2.0) leaves few artifacts of its usage behind making very appealing from an attacker’s perspective.
Microsoft has changed the logging blind spot starting with PowerShell version 5. This version is the default for Windows 10, so if you’re a Windows 10 only shop, you can skip deploying a GPO to turn on logging. The other 99.9% of us will need to do a few things to get version 5 running on Windows 7.
First, you will need to install Windows Management Framework 5.1 on all of your Windows 7 endpoints. This task is left to the reader to figure out what method best fits their environment.
Once that has been installed create a GPO to enforce logging settings across endpoints. This is in Administrative Templates>Windows Components>Windows PowerShell.
There are multiple logging options. For our purposes of enabling tactical monitoring to detect potential attackers, the two most useful are probably PowerShell Script Block Logging and PowerShell Module Logging.
Module logging will record pipeline execution details in Event ID 4103 and has details on scripts and formatted data from the output. Script Block Logging will record code as it is executed by the PowerShell Engine, therefore recording de-obfuscated code, to event ID 4104.
You could also optionally enable PowerShell Transcription to gather the commands entered in every PowerShell session. This will store all input and output to a uniquely named text file in the user’s documents directory. For our purposes of sending log data into a central logging repository to help discover attackers, this is not completely necessary.

An additional caveat for Windows 7 systems is to download the Administrative Templates for Windows 10 and copy the PowerShellExecutionPlicy.admx and PowerShellExecutionPolicy.adml to the \\sysvol\Policies\Policy Definitions directory.
Nxlog Configuration
There are a few options for endpoint agents that will ship Windows Event logs to a central syslog server both open source and paid. Microsoft also offers solutions and strategies to consolidate endpoint logs.
For this post, we chose to use NXlog. The folks at nxlog.co offer a free (Community Edition) and an Enterprise version. The Community Edition should be sufficient for most Windows Endpoint logging tasks and offers the ability to filter based on log types or event IDs.
As with Sysmon, we will install NXlog from the command line:
nxlog-ce-2.9.1716.msi" /quiet
The configuration file that we used is located here. We chose to ship Sysmon, account login, account creation, account login failure, account enabled, account added to local group, and event log cleared. You may want to add to this list based on your monitoring needs. A resource to determine what additional Event IDs may help you find potential attackers is the NSA Spotting the Adversary paper (official link was down at the time of this post).


After you have changed the configuration file to point to your central logging system it needs to be put in place and the NXlog service restarted:
copy /z /y "nxlog.conf" "C:\Program Files (x86)\nxlog\conf"

sc stop nxlog

sc start nxlog
Deployment Options
You may already have a software deployment system in place that can install and configure NXlog and Sysmon. As mentioned earlier, talk with your systems administrator. However, if you do not, GPO deployment is an option.
We chose to deploy with a batch file as a startup script. You can get our example batch file here.
Copy the batch file and the installation and configuration files for both Sysmon and NXlog to a location in the domain’s SYSVOL share and change the batch file path to reflect the location.

Then, use the Group Policy Management to create a new GPO. Edit the GPO and navigate to Policies>Windows Settings>Scripts and select Startup, right-click and select properties of Startup.

Click “Add” and browse to your install.bat script network location. Click “OK”, then apply the changes. Close the editor and right-click on the GPO and make sure “Enforced” is selected.

Elastic Stack
For the Elastic Stack, we used a stock install of Ubuntu 16.04 and the Debian Package files for Elasticsearch, Logstash, and Kibana. Once your Ubuntu server is up and running download the files from elastic.co and install with dpkg.
dpkg -i elasticsearch-5.4.3.deb

dpkg -i kibana-5.4.3-amd64.deb

dpkg -i logstash-5.4.3.deb
Edit the /etc/kibana/kibana.yml with your favorite text editor, which is, of course, Vi, and change the line with “server.host:” to reflect the IP address of the system.

Now we need to put a logstash filter in place to properly format the incoming log files and get them into Elasticsearch. Download the logstash configuration file from here and put it in the /etc/logstash/conf.d directory.
Now start the Elasticsearch, Logstash, and Kibana services.
systemctl start elasticsearch

systemctl start logstash

systemctl start kibana
Navigate to your system’s IP address and port 5601. You should see a Kibana service page. Change “logstash-*” to “winevent-*” and click “Create”. If all goes according to plan you should already see some events coming in.


Please realize that while the components covered in this post can be used for an enterprise deployment, actual implementation will require some considerations not covered. For example: secure authentication, encrypted communication, and hardware requirements for handling larger volumes of traffic from thousands of workstations. These are not insurmountable problems and every environment is different and has unique requirements. Adapt the tools and concepts to fit your needs.
You can learn more straight from Joff himself with his classes:
Regular Expressions, Your New Lifestyle
Enterprise Attacker Emulation and C2 Implant Development
And with Derek in his!
Available live/virtual and on-demand

rio
July 10, 2017 @ 2:19 pm
Surprised not to see any mention of osquery here. It’s used heavily at Facebook (where it was developed) as well as many other large and medium orgs.
“Performant Endpoint Visibility
osquery allows you to easily ask questions about your Linux, Windows, and macOS infrastructure. Whether your goal is intrusion detection, infrastructure reliability, or compliance, osquery gives you the ability to empower and inform a broad set of organizations within your company.”