Wrangling Windows Event Logs with Hayabusa & SOF-ELK (Part 1)


Event Logs are one of my favorite Windows artifacts, but they are voluminous, and only a small percentage of events provide value during most security investigations. There are typically a few hundred thousand event log entries on a single Windows endpoint and, though they are not difficult to acquire, parsing, filtering, and searching to effectively and efficiently derive actionable intelligence can be challenging. In part 1 of this post, we’ll discuss how Hayabusa and “Security Operations and Forensics ELK” (SOF-ELK) can help us wrangle EVTX files (Windows Event Log files) for maximum effect during a Windows endpoint investigation! In part 2, we’ll discuss scaling this to many systems in conjunction with my “Rapid Endpoint Investigations” workflow (https://github.com/secure-cake/rapid-endpoint-investigations; https://www.youtube.com/live/XfUjST9kXdU?feature=shared).
Hayabusa meaning “peregrine falcon” in Japanese, is the namesake of a pretty sick Suzuki sport bike, as well as a Windows event log “fast forensic timeline generator and threat hunting tool.” Hayabusa was created and is supported by Yamato Security, with over 4,000 SIGMA rules and more than 170 built-in detection rules to help us find the event log entries we are looking for! When we run Hayabusa against our EVTX files, we get timeline output in CSV or JSON file format with rule “hits” containing date/timestamp, rule title, severity level (“info” to “emergency”), and event details.
You can check out the Hayabusa GitHub repo here: https://github.com/Yamato-Security/hayabusa
When performing Windows endpoint investigations, with a typical average of 200K-500K event log entries per host, we can use Hayabusa to reduce and prioritize our event analysis. We’ll get around 75% reduction in event-log entries in our Hayabusa timeline output, which is hugely significant, but this still leaves us with tens of thousands of entries per endpoint. We can prioritize our investigation by further filtering our Hayabusa output by severity, focusing on high-severity rule hits, e.g. “critical” and “high.” Even with this level of reduction and prioritization, we may still be wrangling many thousands of entries, which can be challenging via Excel or another CSV/JSON tool!
Enter “Security Operations and Forensics ELK,” aka SOF-ELK, which is a “big data analytics platform focused on the typical needs of computer forensic investigators/analysts,” available in a prepackaged Virtual Machine, with prebuilt parsers for Hayabusa ingestion (among many other log/file types), and an intuitive web UI for searching and filtering. Thank you, Phil Hagen!
You can check out the SOF-ELK GitHub repo, download a prepackaged VM, etc. here: https://github.com/philhagen/sof-elk
To recap, EVTX files are a useful Windows endpoint investigative artifact, Hayabusa can help us find events of interest, and SOF-ELK can help us ingest, parse, and then search, sort, and filter our EVTX output. Let’s get into the nuts and bolts of how we can accomplish this for a single Windows endpoint.
First, visit the Hayabusa GitHub repo and download the latest stable release to your analysis system. Note that Windows, Mac, and Linux are supported platforms. I’ll be using the Windows version (v.3.3.0 at the time of this writing – hayabusa-3.3.0-win-x64.zip): https://github.com/Yamato-Security/hayabusa/releases/tag/v3.3.0
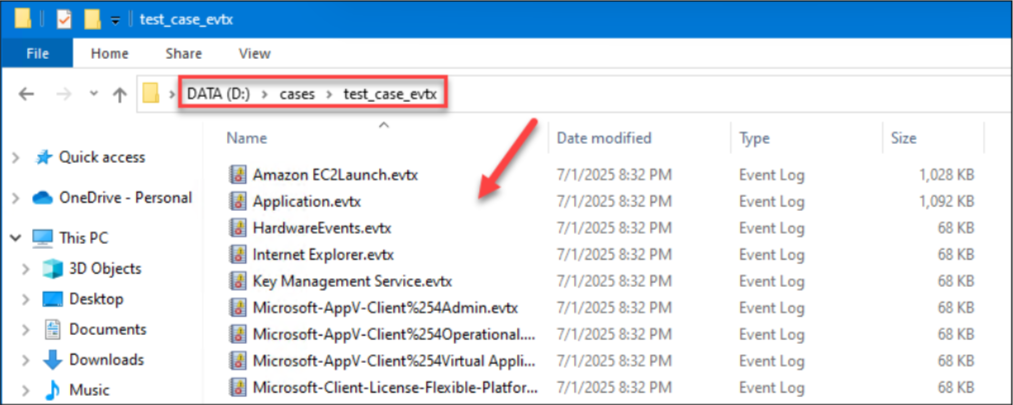
I’ll extract the hayabusa-3.3.0-win-x64.zip file to “C:\Tools” and stage my test case EVTX files in a “D:\cases\test_case_evtx” directory.
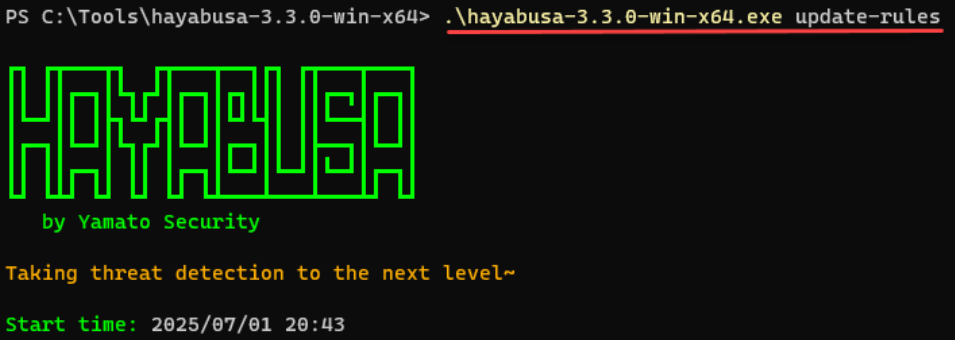
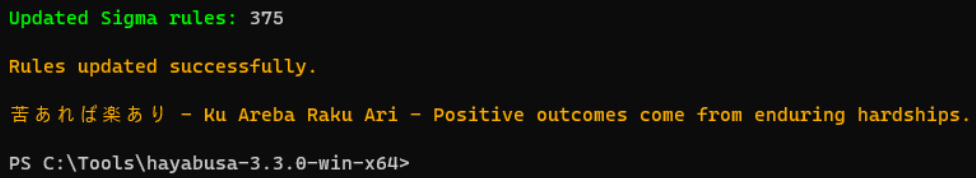
Next, I’ll open Windows Terminal – PowerShell 7, navigate to the “C:\Tools\Hayabusa-3.3.0-win-x64” directory and update Hayabusa rules via the “.\hayabusa-3.3.0-win-x64.exe update-rules” command. You’ll likely see a bunch of updated rules scroll by!
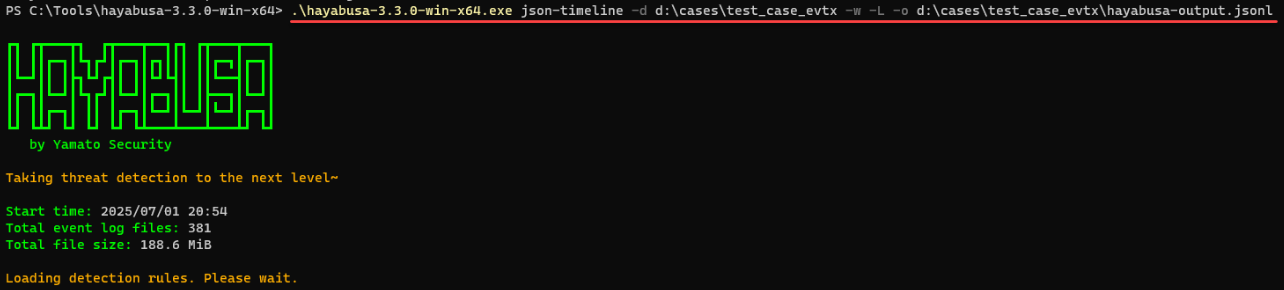
Now that the rules are up to date, I’ll create a JSON timeline from the “test_case_evtx” files for ingestion into SOF-ELK using the following command:
“.\hayabusa-3.3.0-win-x64.exe json-timeline -d d:\cases\test_case_evtx -w -L -o d:\cases\test_case_evtx\hayabusa-output-Host123.jsonl” 
You can invoke detailed “help” for the “json-timeline” command using the following syntax:
“.\hayabusa-3.3.0-win-x64.exe json-timeline --help" The “-d” switch tells Hayabusa to look in a “Directory” for all EVTX files for processing, “-w” stops the “Wizard” from loading, “-L” specifies “JSONL” file output, and “-o” specifies the path and filename for output. For reference, my input included a total of 381 event log files, about 190 MB, and took about one minute to process.
NOTE: It’s a good idea to name your output file uniquely, e.g. “hayabusa-output-HostXYZ.jsonl.” This will make life easier when we want to ingest multiple output files into SOF-ELK (part 2 of this blog)!
Upon command completion, you should have a “JSONL” output file and a screen of metadata about the scan, detections, output, rules, etc. (excerpt below):
Now that we have our Hayabusa output staged, we can set up SOF-ELK for ingestion and review. You’ll need VMWare Workstation/Player/Fusion (see detailed requirements on the SOF-ELK README page) and a pre-packaged VM appropriate to your platform (ARM or x86):
https://github.com/philhagen/sof-elk/wiki/Virtual-Machine-README
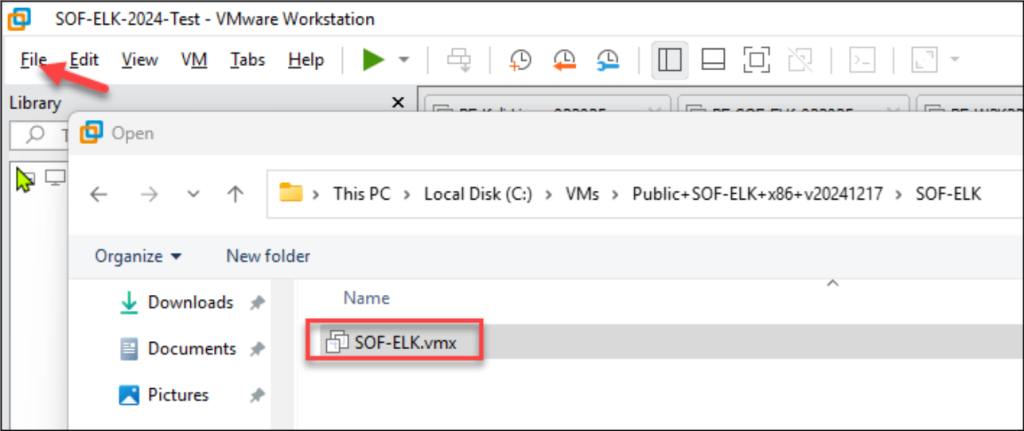
Once you download and extract the VM (v20241217.7z archive at the time of this writing), you can launch VMWare, click “File\Open,” navigate to the extracted SOF-ELK VM archive, and open “SOF-ELK.vmx:”
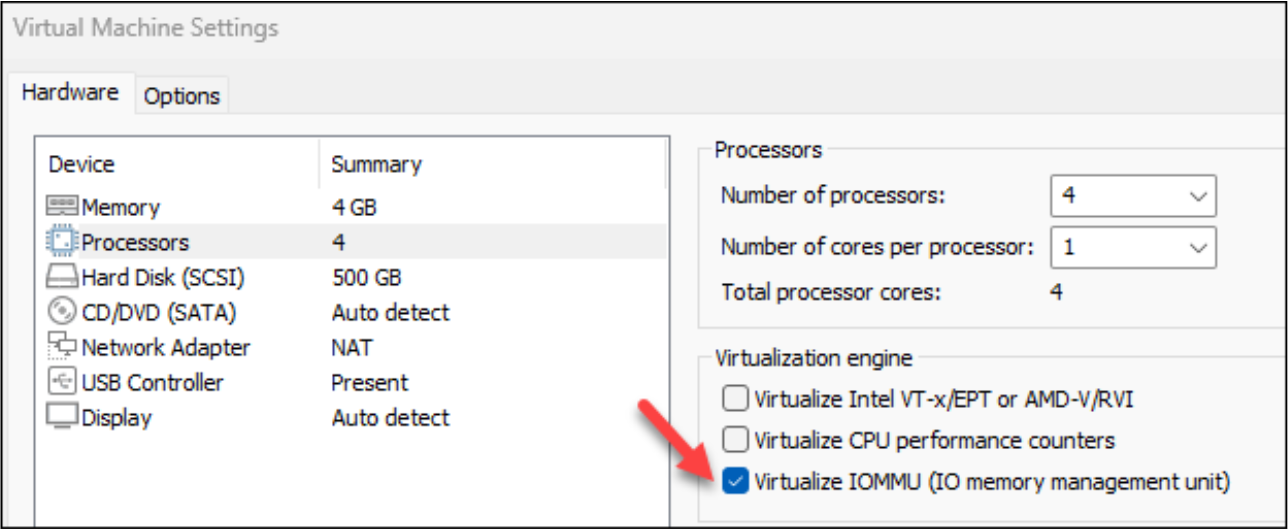
When running the VM on a Windows system, I generally “Edit virtual machine settings” and enable “Virtualize IOMMU” for better UI performance, but that is optional!
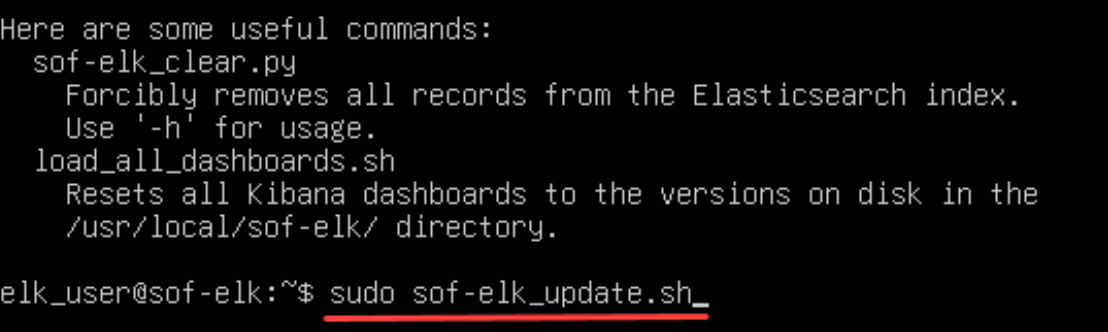
Now you can power on your SOF-ELK VM, login using “elk_user” with a password of “forensics,” and then run “sudo sof-elk_update.sh” to make sure SOF-ELK is up to date:
Once the SOF-ELK update is complete, we can copy our Hayabusa output into the proper “logstash” folder, exercise a bit of patience while the SOF-ELK magic occurs, and then begin to analyze our data via the web UI.
We’ll use “scp” (secure copy) to copy our output data from our Host system to SOF-ELK. First, let’s check the IP address of our SOF-ELK VM:
$ip -br a 
NOTE: Your IP address will be slightly different than mine!
Now open a Windows PowerShell prompt on your Host system and enter the following command, changing the IP address to match the IP on your SOF-ELK VM:
scp d:\cases\test_case_evtx\hayabusa-output-HostXYZ.jsonl [email protected]:/logstash/hayabusa/ When you first authenticate via scp to your SOF-ELK VM, you’ll be prompted to accept the cert fingerprint. Type “yes” and hit enter to continue, then enter the “elk_user” password: forensics. You should then see the file transfer complete at 100%.
On your SOF-ELK VM, you can check the progress of ingestion and population of Elasticsearch indices by running the following command:
sof-elk_clear.py -i list Again, with a little patience, you should see something like the screenshot below indicating that the “evtxlogs” index is being populated:
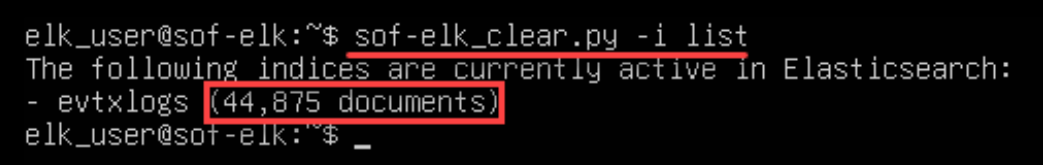
NOTE: Your document number will be different!
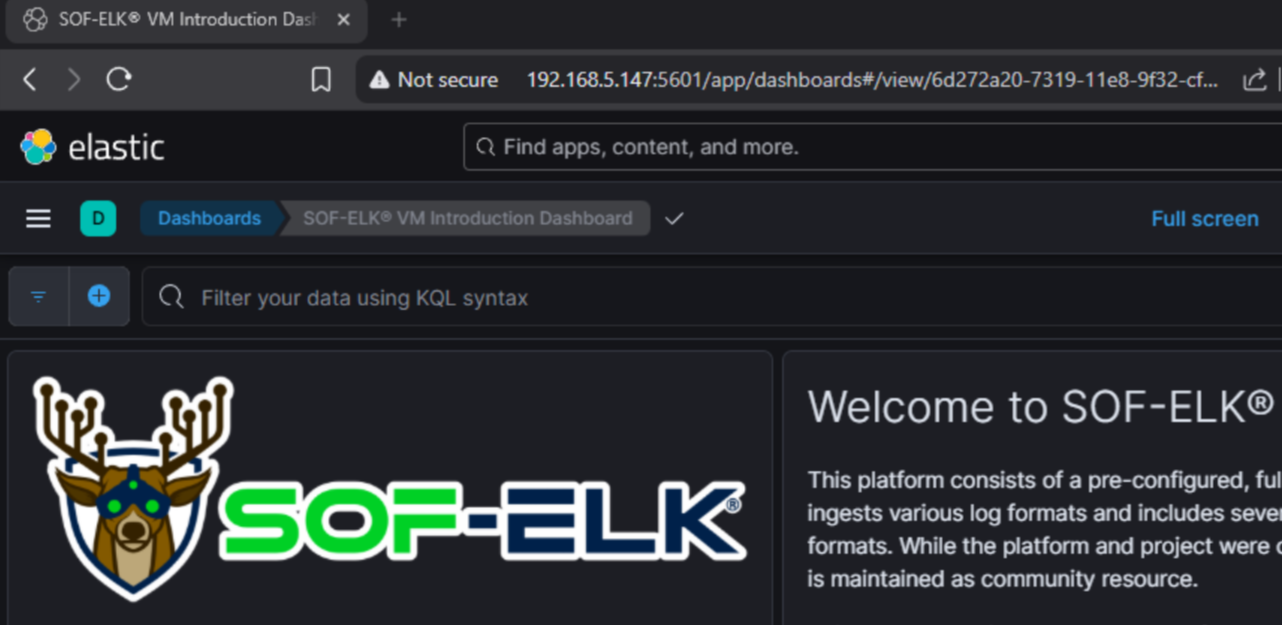
Now we can visit the SOF-ELK web UI and begin our Hayabusa output review. On your Host system, open a browser and visit your SOF-ELK IP address, specifying port 5601: http://192.168.x.x:5601
This should get you to the SOF-ELK default dashboard so you can check out the sweet ELK with nods (Dual tube even?!? I’m super jealous!):
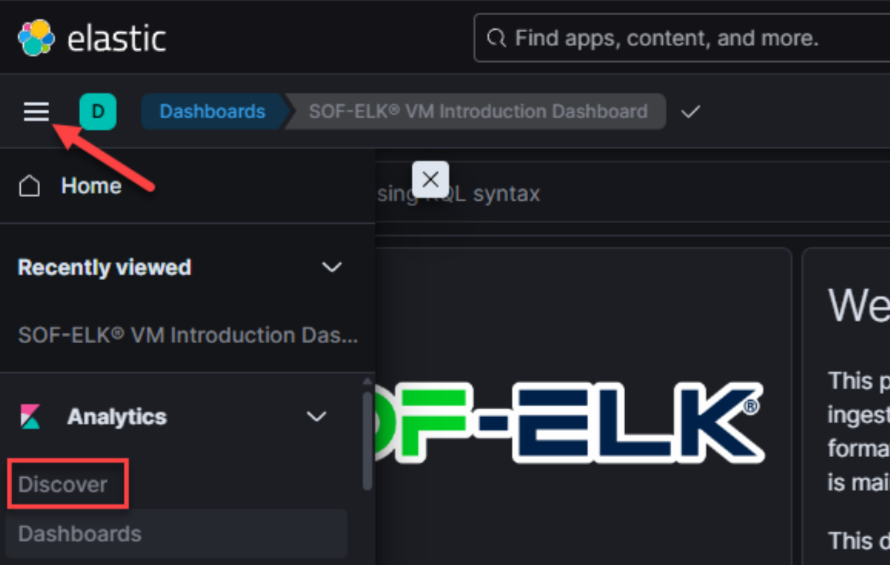
Let’s click on the “hamburger” (three lines) icon and select “Discover:”
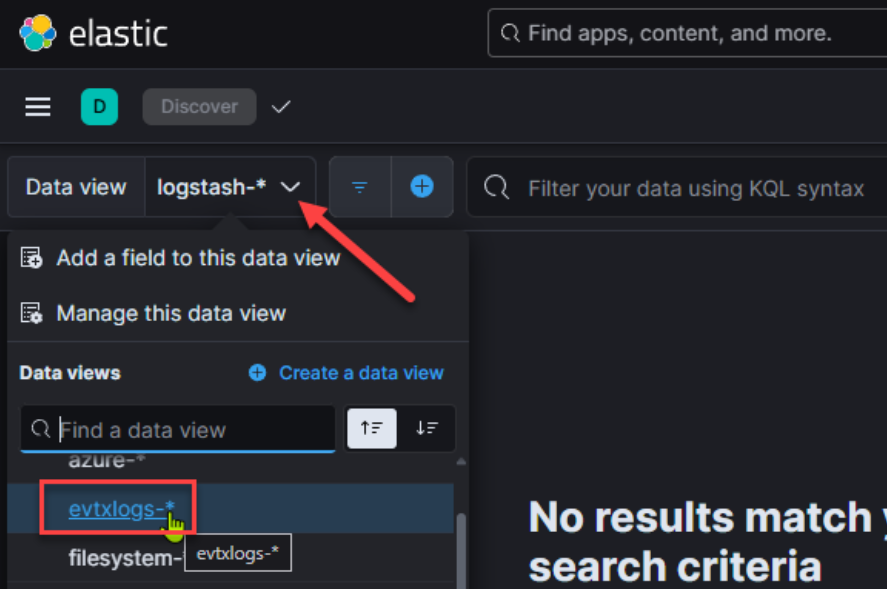
Next, select the “Data View” dropdown and change Data View to “evtxlogs-*”:
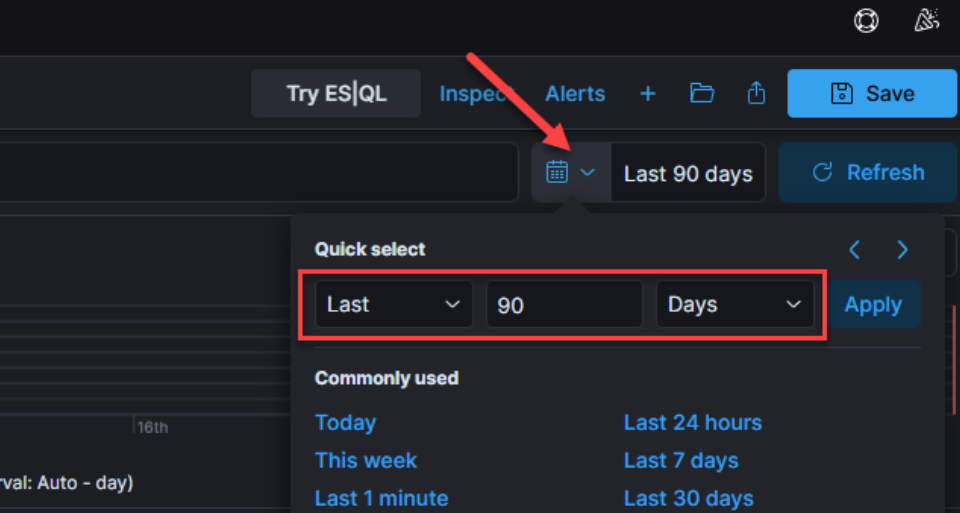
IMPORTANT: Now, we need to change our “data view” date range to reflect relevant dates for our investigation. The easiest way to do this is by clicking the “Date quick select” and selecting a relative range, e.g. “Last 90 days.” It is a good idea to be relatively precise when setting this for an investigation to accurately constrain your results and to improve performance:
Once we set the date, we should start to see results populate in our data view. It’s a good idea to be conscious of clicking the “Refresh” button after any web UI parameter changes!
For my sample EVTX files, which came from an infected test system, I started with about 145K event-log entries, with resultant Hayabusa timeline entries of just under 16K. Again, this is a hugely significant reduction! The next steps are to find evil!
One of the things I love about SOF-ELK (Elastic) is that the web UI can be largely self-guiding. I like to start by expanding one event, then selecting the data fields I want to see in the Documents view.
Click the “Toggle dialog with details” double arrow for a document entry:
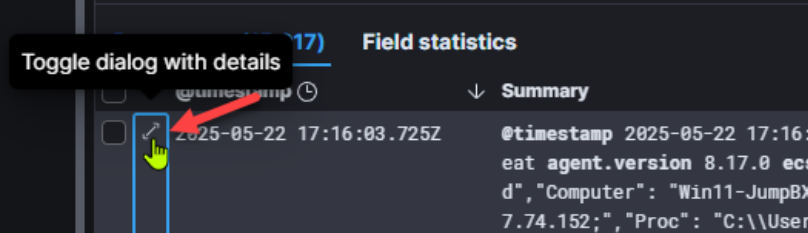
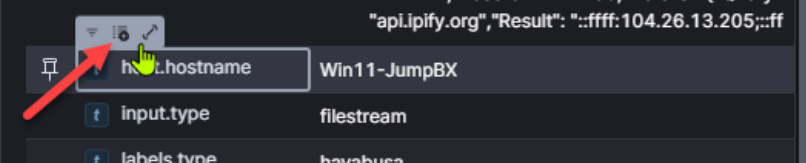
This will expand the document table on the right. Now we can begin to review available fields and “toggle” fields on or off in our document view. I’ll “toggle” on the following fields:
- host.hostname
- rule.level
- rule.name
- winlog.event_id
IMPORTANT: The available fields will change based on original event type. As we narrow our search results and step through our analysis, we’ll want to adjust the “toggled” fields based on the types of events we are analyzing.
NOTE: You may also want to add the “labels.type” field to your view to differentiate between standard EVTX logs and Hayabusa-processed EVTX logs, both of which reside in the “evtxlogs” index. For this example, we are only using Hayabusa output.
Next, I generally want to review high-severity detections. You can either “filter in” these rule levels (rule.level) or filter out low-severity levels. I’ll go ahead and filter out “low-severity” rule levels (info, low, med) with the following KQL syntax:
NOT rule.level: "info" and NOT rule.level: "low" and NOT rule.level: "med" 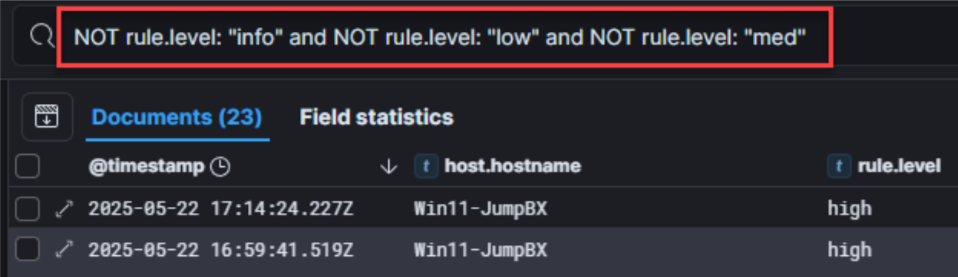
NOTE: There are approximately 93 ways to format your SOF-ELK query! If you have a way that works for you, do that! There are shorter ways to draft the above, but this query is intentionally long and pedantic, to be super clear and easy to understand/edit.
I have now reduced my sample data to 23 documents for initial review. Once I review the high-severity entries, I’ll build out context for my analysis (date/time, user, file, path, etc.) and then use that context to guide my analysis of “med” rule hits.
SIDE NOTE: One of the things I love about the SOF-ELK (Elastic) interface is the ability to copy/paste a URL into a new tab! Once I format my document view and create a filter, as above, instead of immediately altering my query to continue my analysis, I’ll often copy/paste my current SOF-ELK URL into a new browser tab and then alter my query syntax in the new tab, leaving my original format/query/data in the previous tab so I can easily return, review, and tune!
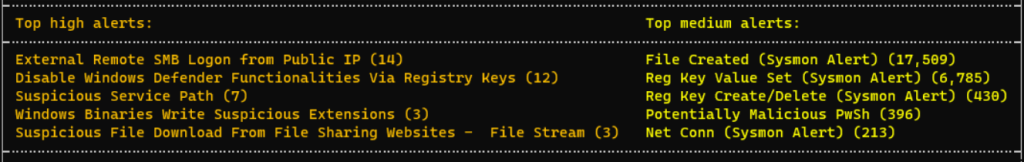
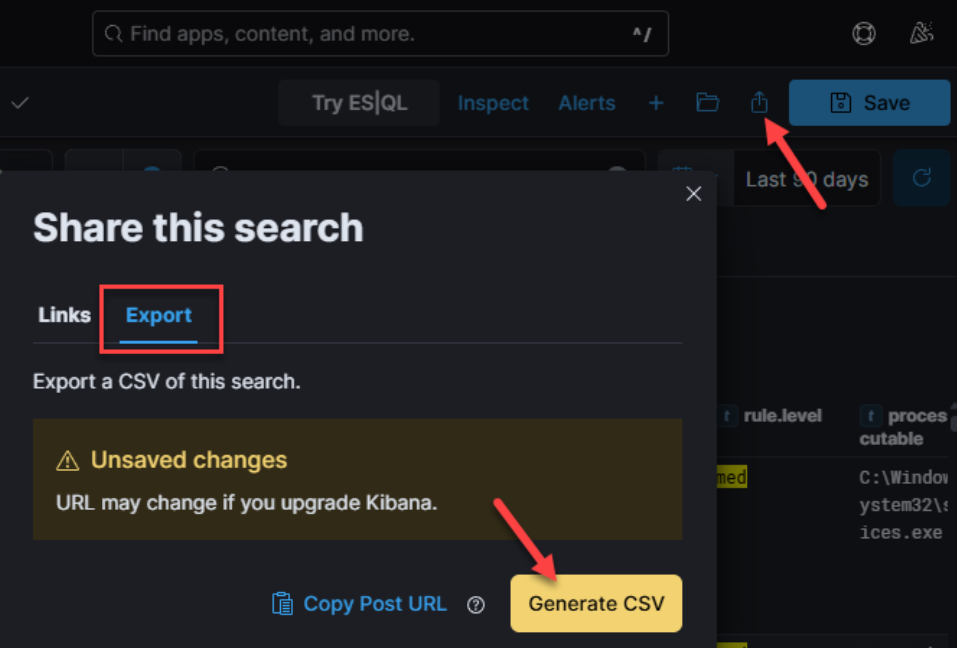
Now you can let your analytical workflow be your guide! Narrow in on date/time pertinent to your investigation, toggle fields on and off to highlight potential answers to your investigative questions, filter in/out results based on any field or multiple fields, expand and contract all the above until you’ve determined attack extents, and export your precisely-filtered data to CSV for safekeeping or to share with others:
Stay tuned for part 2 where we’ll build on this post to scale our EVTX wrangling from “one to many” hosts as part of my “Rapid Endpoint Investigations” workflow (https://github.com/secure-cake/rapid-endpoint-investigations, https://www.youtube.com/live/XfUjST9kXdU?feature=shared).
Ready to learn more?
Level up your skills with affordable classes from Antisyphon!
Pay-Forward-What-You-Can Training
Available live/virtual and on-demand