Azure Security Basics: Log Analytics, Security Center, and Sentinel
TL;DR
The problem with a pentester’s perspective on defense, hunting, and security: Lab demographics versus scale.
If it costs $15 bucks per month per server for me to get ATP data, demo its effectiveness, provide tips, tricks, and some basic guidance to the world, this is affordable. Deploying ATP on 5,000 virtual servers on Azure is just shy of a million bucks a year, which to me, seems really expensive. But, I don’t maintain any other EDR platform, so maybe it’s cheap? I just don’t know… But, I do know that Log Analytics, Sentinel, and ATP can produce a complete picture of your Azure authentication border defenses, virtual server happenings, and everything in between them.
Getting Started (Log Analytics)
There is a terminology section at the bottom, and you may need to reference it to put together the complete picture. Deploy a VM, or deploy a lab (APT Lab via Terraform at the bottom), or make sure one of your existing resources is being monitored. Then, click over to Azure’s Log Analytics workspaces dashboard. If you are planning to follow along, you can complete a lot of these steps on a demo environment maintained by Microsoft (linked below: DemoLogsBlade).
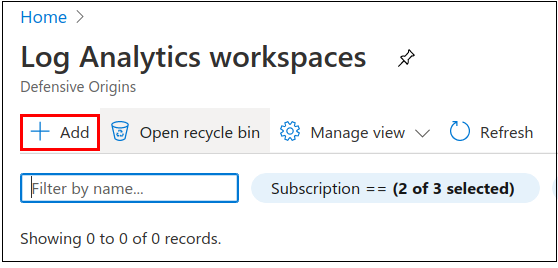
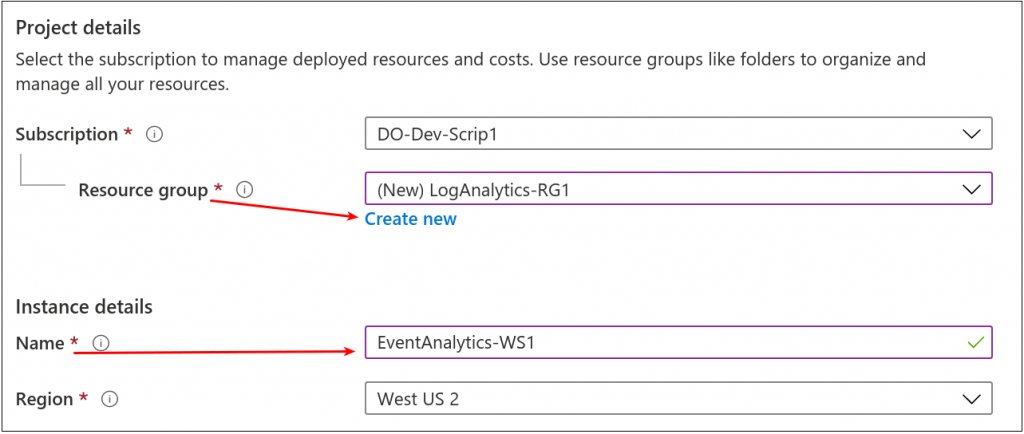
Add a new workspace, maybe a Resource group too if you want to keep things containerized.
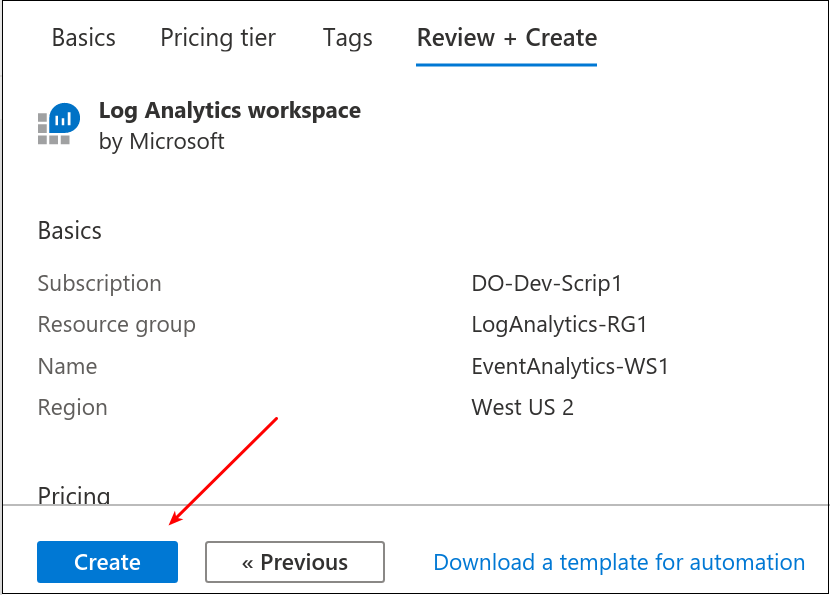
The pricing tier question seemed obvious, but here it is anyway.
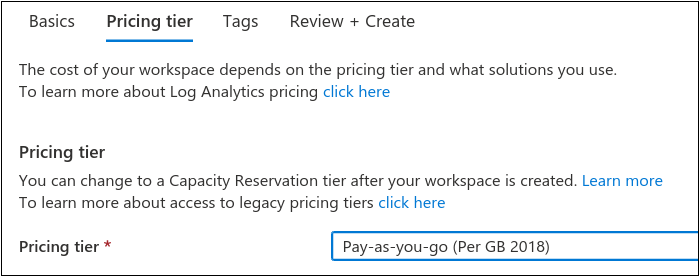
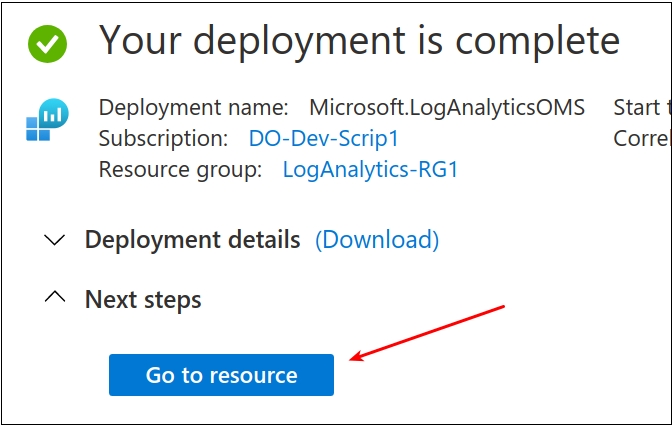
Finally, click create. Once this is complete, we should have a Log Analytics dashboard.
There was much rejoicing, and we clicked “Go to resource.”
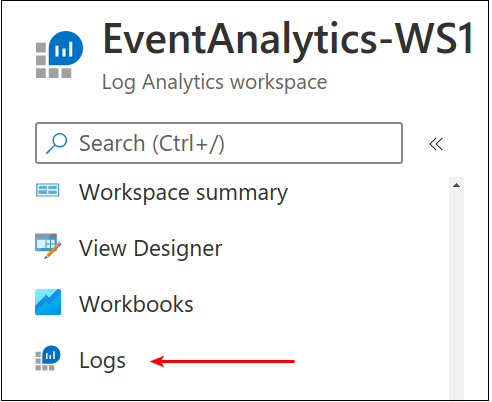
From the navigation tree, scroll down to Logs.
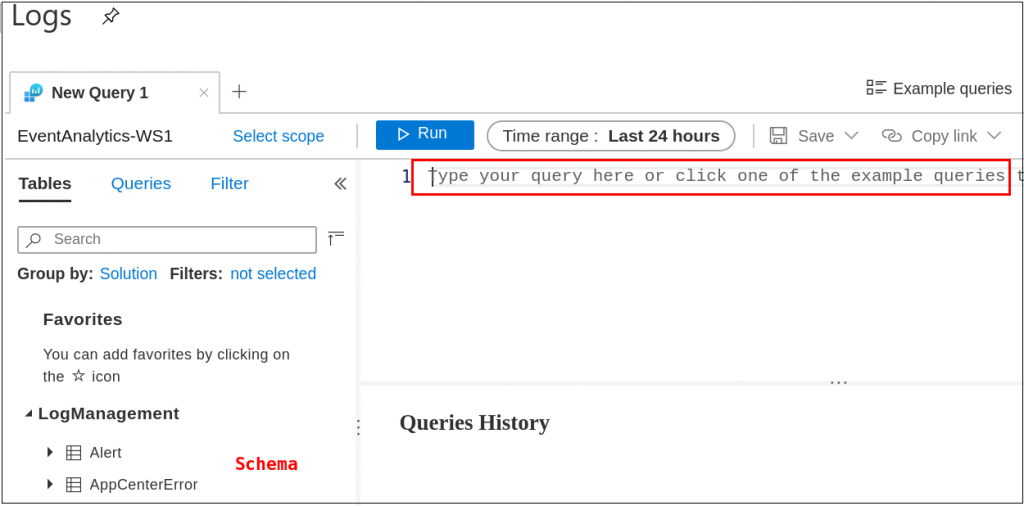
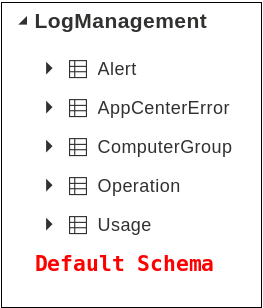
Then, we land on the Logs dashboard, which on the left, we find the LogManagement schema. The Microsoft definition basically says the schema is a “…collection of tables grouped under logical categories.” The default, as shown, only has a few Tables. But, this will update akin to Elastic’s log index growth when we add new event sources. Also highlighted is the queries pane which we will see again after a while.
For documentation’s sake, an out-of-the-box schema appeared as follows.
Let’s add some log sources — which the Azure platform facilitates with a few clicks. First up, let’s get our VMs connected to the Event Analytics workspace.
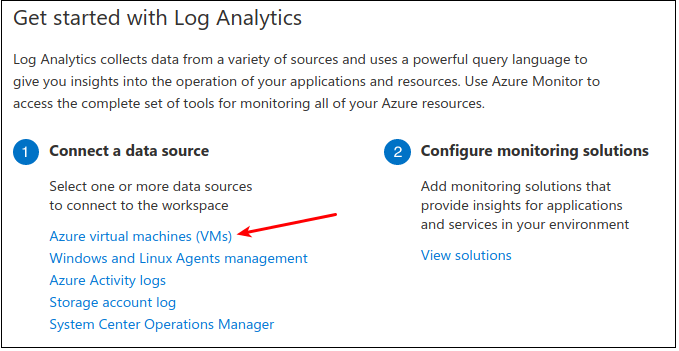
Navigate to Home > Log Analytics Workspace > EventAnalytics-WS1 > under Get Started with Log Analytics, find 1. Connect a data source then click on Azure virtual machines.
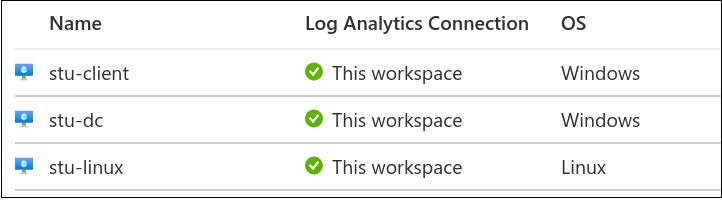
Further disclosure, the VMs listed below were deployed using the Terraform script from here. (We’ll have a blog about that soon too!)
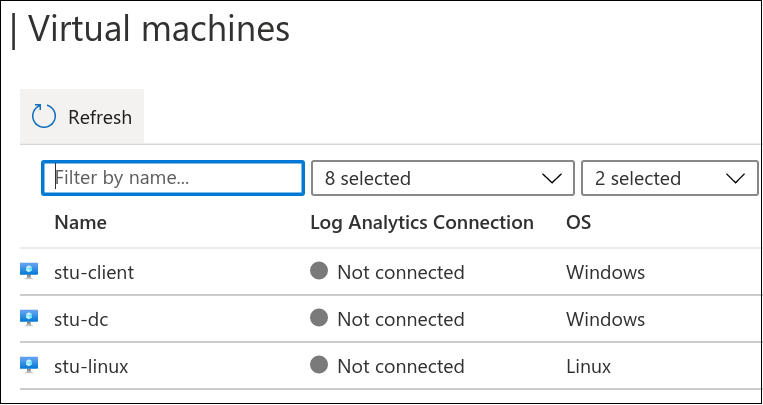
Click on any of the virtual machines listed in this panel.
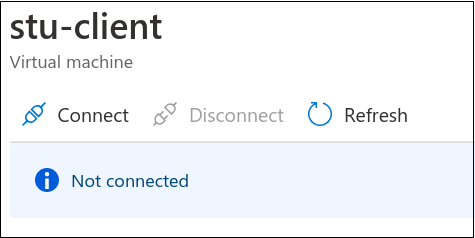
Click Connect. About five minutes, and the systems are connected.
Next up, install the Log Analytics Agent. Navigate to Home > Security Center > Getting Started > Install Agents tab. Check the appropriate boxes for your subscriptions and click Install Agents.
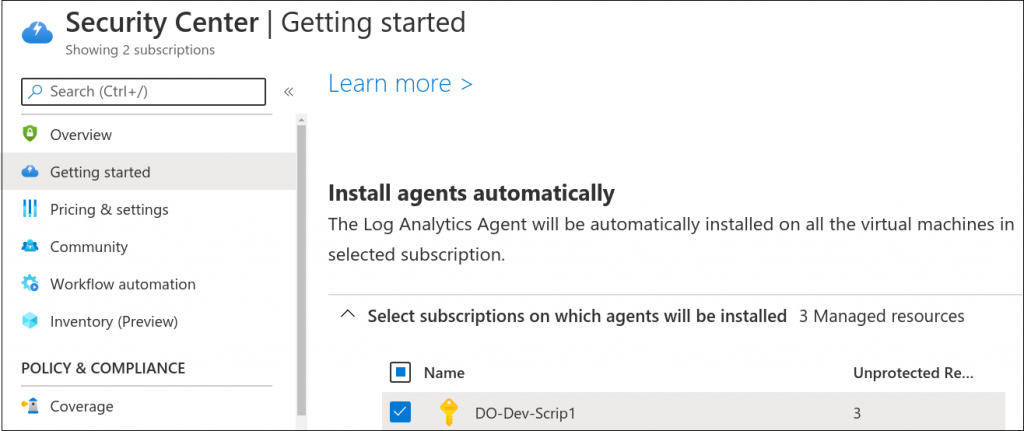
This function will install the Log Analytics agent on these systems. It takes just a few, so feel free to freshen your tea.

Events, Event Handling, and Our First Optics
(Caution: Inbound Charges are Likely)
To gather the first set of Security Events, we need to enable them, and that costs money. Proceed with consideration for your own wallet. We will summarize the charges at the end of the blog for this effort. This includes spinning up an APT Lab of three VMs, which cost about $2.40 per day each. This will include the Pay-As-You-Go pricing for log consumption.
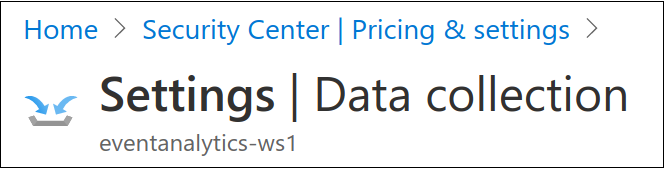
Navigate to Home > Security Center > Pricing & Settings.
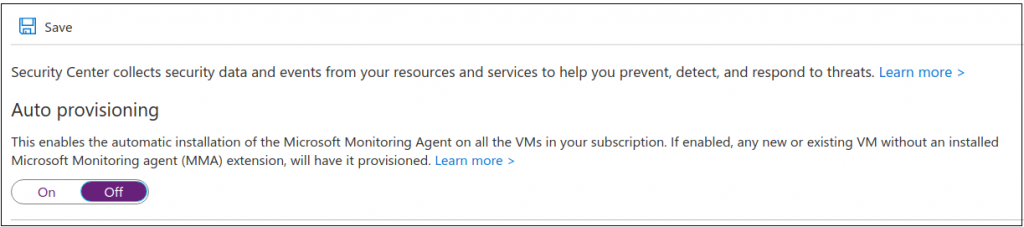
Once there, the first thing I did was Disable Auto-Provisioning. This will keep all the future VMs I deploy from magically costing money without interaction.
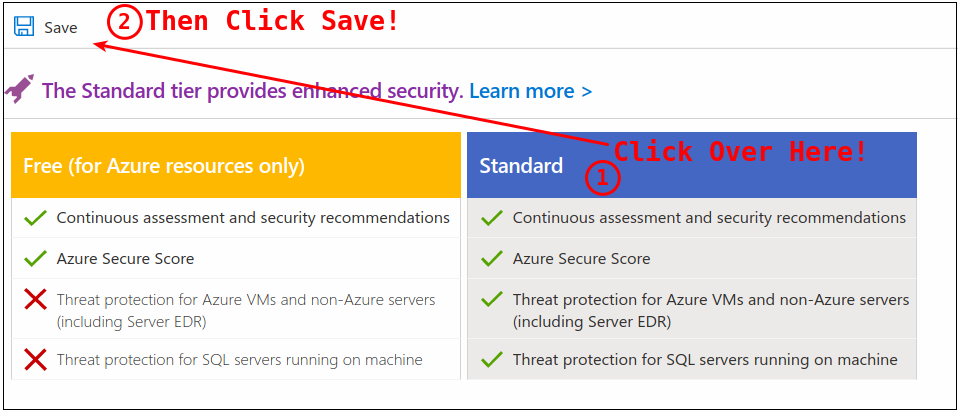
It’s time to enable Standard tier pricing. This will enable the event management we need to start seeing events in our log analytics dashboard.
Navigate to Home > Security Center > Pricing & Settings.
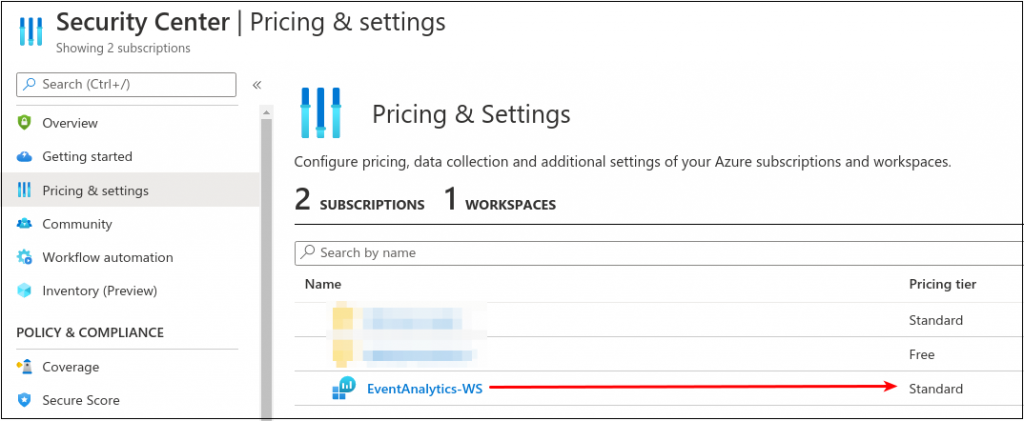
Edit the workspace created during this process and switch the pricing over to standard so we can enable all events.
Next, navigate to Home > Security Center > Pricing & Settings > Continuous Export. Here we need to enable the appropriate Exported data types.
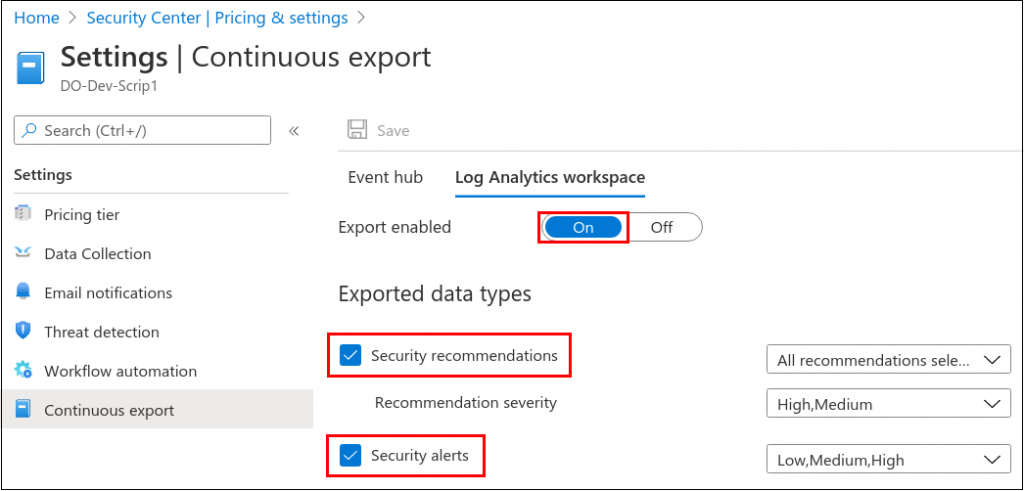
At this point, we should have some initial events.

Next Up, Azure Sentinel
Navigate to Home > Sentinel. Click Add.

Next up, add the workspace.
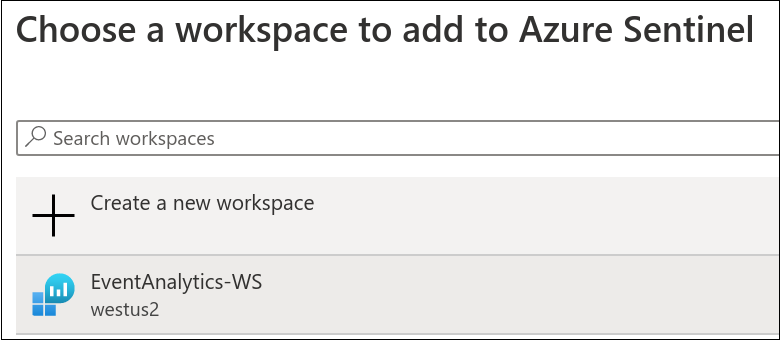
Once everything was connected, getting Sentinel online was just a couple of clicks.
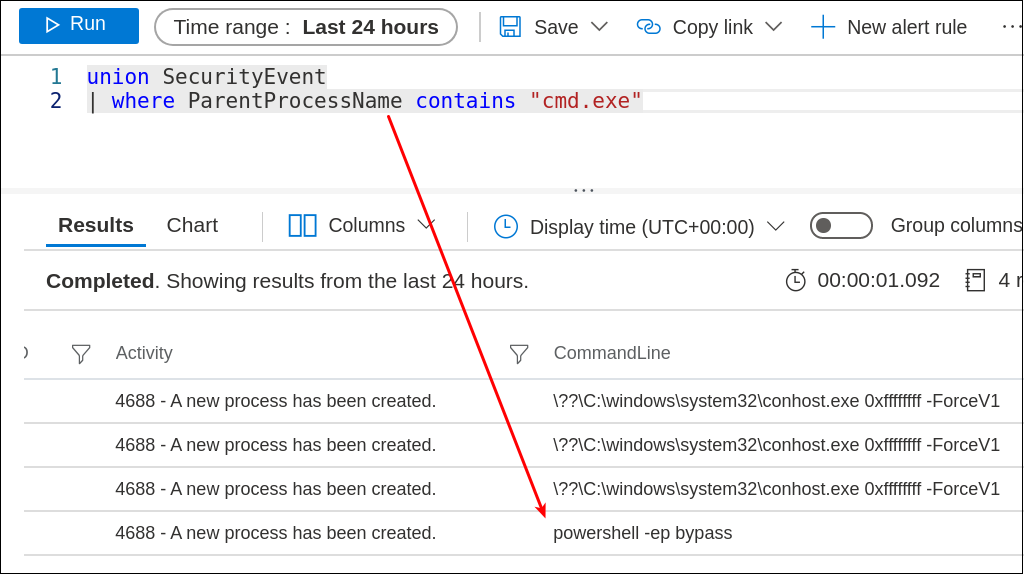
And thus begins our hunt operations on Azure. So many questions left to address, so many directions to go, and so many events to search.
The next blog, already in the works, is to deploy this via Roberto’s work (OTRF) on AzureSentinel2Go. This is one of my favorite logos…
Terminology
Tenant – Accounts and Groups
Subscription – Agreement with Microsoft
VM – virtual machine on Azure space
Log Analytics – Logging dashboard for Azure
Log Analytics Agent – installed on VMs for event integration
ATP – Advanced Threat Protection, expensive, but holy amazing
Links
- https://docs.microsoft.com/en-us/azure/azure-monitor/log-query/get-started-portal
- https://ms.portal.azure.com/#blade/Microsoft_Azure_Monitoring_Logs/DemoLogsBlade
- https://docs.microsoft.com/en-us/azure/security-center/security-center-enable-data-collection
- https://docs.microsoft.com/en-us/microsoft-365/enterprise/subscriptions-licenses-accounts-and-tenants-for-microsoft-cloud-offerings?view=o365-worldwide
- https://docs.microsoft.com/en-us/connectors/azureloganalyticsdatacollector/
- https://github.com/OTRF/Azure-Sentinel2Go (next up, deployed, and in queue)
Want to learn more mad skills from the person who wrote this blog?
Check out these classes from Jordan and Kent:
Assumed Compromise – A Methodology with Detections and Microsoft Sentinel
Available live/virtual and on-demand!