GNU Radio Primer
Ray Felch //
Disclaimer: Be sure to use a faraday bag or cage before transmitting any data so you don’t accidentally break any laws by illegally transmitting on regulated frequencies. Additionally, intercepting and decrypting someone else’s data is illegal, so be careful when researching your traffic.

Preface:
Recently, I introduced myself to the world of SDR (Software Defined Radio) and admittedly learned a great deal in the process. I discovered that not only could I emulate actual radio-frequency (RF) hardware components using various software applications such as SDR Sharp, GQRX, SIGINTOS, CubicSDR, RTL-SDR supported software, etc, I could also use GNU Radio flow graphs such as ‘grgsm_livemon.grc’ to capture GSM mobile network packets live in the wild.
As informative and educational as this project was, I wanted to understand GNU Radio flow graphs in greater detail. I wanted to know the basics of creating these flow graphs, rather than just relying on using preexisting flow graphs without fully understanding why (or how) it worked.
Although there is quite a bit of documentation available on the internet, GNU Radio (and GNURADIO-COMPANION) can still be a bit daunting and intimidating when first approached. After doing a few Google searches, I eventually stumbled upon some online lessons provided by Michael Ossmann of Great Scott Gadgets and I found that this helped me tremendously. https://greatscottgadgets.com/sdr/ Also, the GNU Radio Tutorials https://wiki.gnuradio.org/index.php/Tutorials helped to reinforce what I had just learned.
In order to familiarize myself with the basics of GNU Radio, I chose a project that might be used with regard to replay attacks (finding, capturing, and replaying a raw RF signal), to unlock my 1999 Ford Mountaineer bypassing the FOB (frequency operated button).
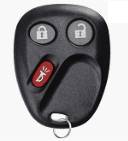
It needs to be stated upfront, that although I was able to capture the unlock signal from my FOB and replay that signal (transmitted using the HackRF), it did not actually unlock my vehicle. The reason for this is because changes were made, many years ago, to help prevent these replay attacks, using a technique known as ‘rolling code’ (sometimes referred to as ‘hopping code’).
Prior to this change, vehicles and garage door openers used fixed codes and were susceptible to being discovered by an attacker with the appropriate receiver. This information could be used by the attacker to gain access sometime later. At the time of this write-up, there have been numerous mentions of a rolling code work-around, including using jamming techniques and code reset techniques.
Regardless, I found that working through the project was worth the effort. It provided me with a better understanding of GNU Radio and the knowledge required to create my very own working flow graphs.
Basic GNU Radio and Flow Graph Information:
- All signal processing in GNU Radio is done using flow graphs, comprised of individual blocks that perform one digital signal processing operation, such as filtering, decoding, multiplexing, etc.
- This data passes between these blocks in various formats, complex or real integers, floats or basically any kind of data type that you define.
- Every flow graph needs at least one source block (input) and one sink block (output).
- A source or sink might be a USB dongle HackRF, BladeRF, etc), a sound card, a file or an fft (Fast Fourier transform), just to name a few. https://en.wikipedia.org/wiki/Fast_Fourier_transform
Obtaining my FOB specific information:
In order to determine the operating frequency of my FOB, I first searched for the FCC number associated with my vehicle. A Google search, followed by an FCC search provided the following information:
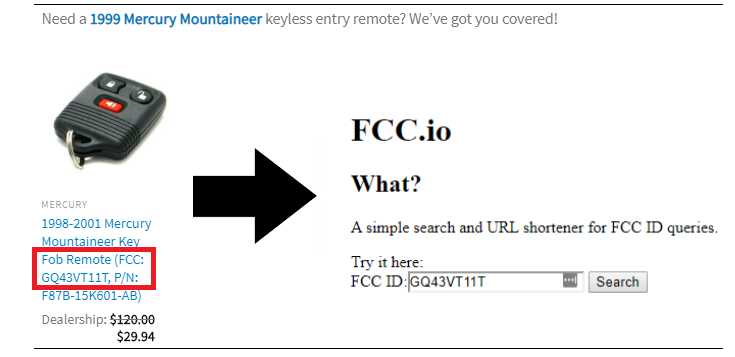
The FCC search results provided the frequency I was looking for:
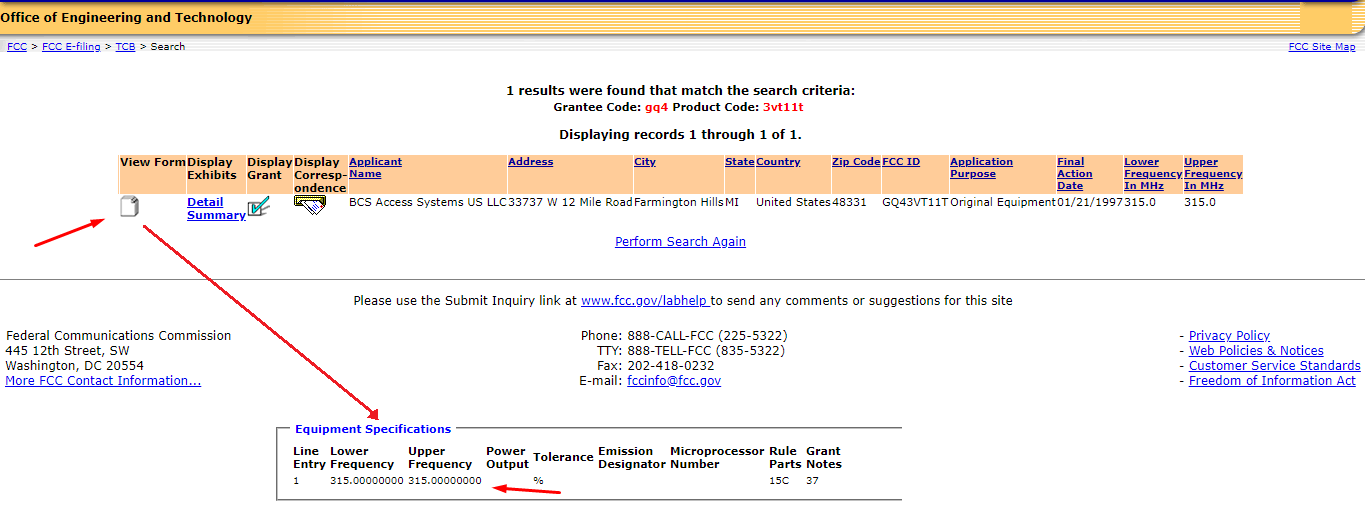
Armed with the RF frequency of my device (315Mhz), it was time to attempt a capture of the ‘unlock vehicle’ signal. Normally, I could have used one of the many available apps (SDR Sharp, etc.) to monitor for, and capture the raw data, however this time I wanted to create the building blocks myself using the GNU Radio flow graphs.
I moved into my home projects directory and issued the following command:
$ sudo gnuradio-companion
Upon loading gnuradio-companion, I clicked to create a new flow graph:
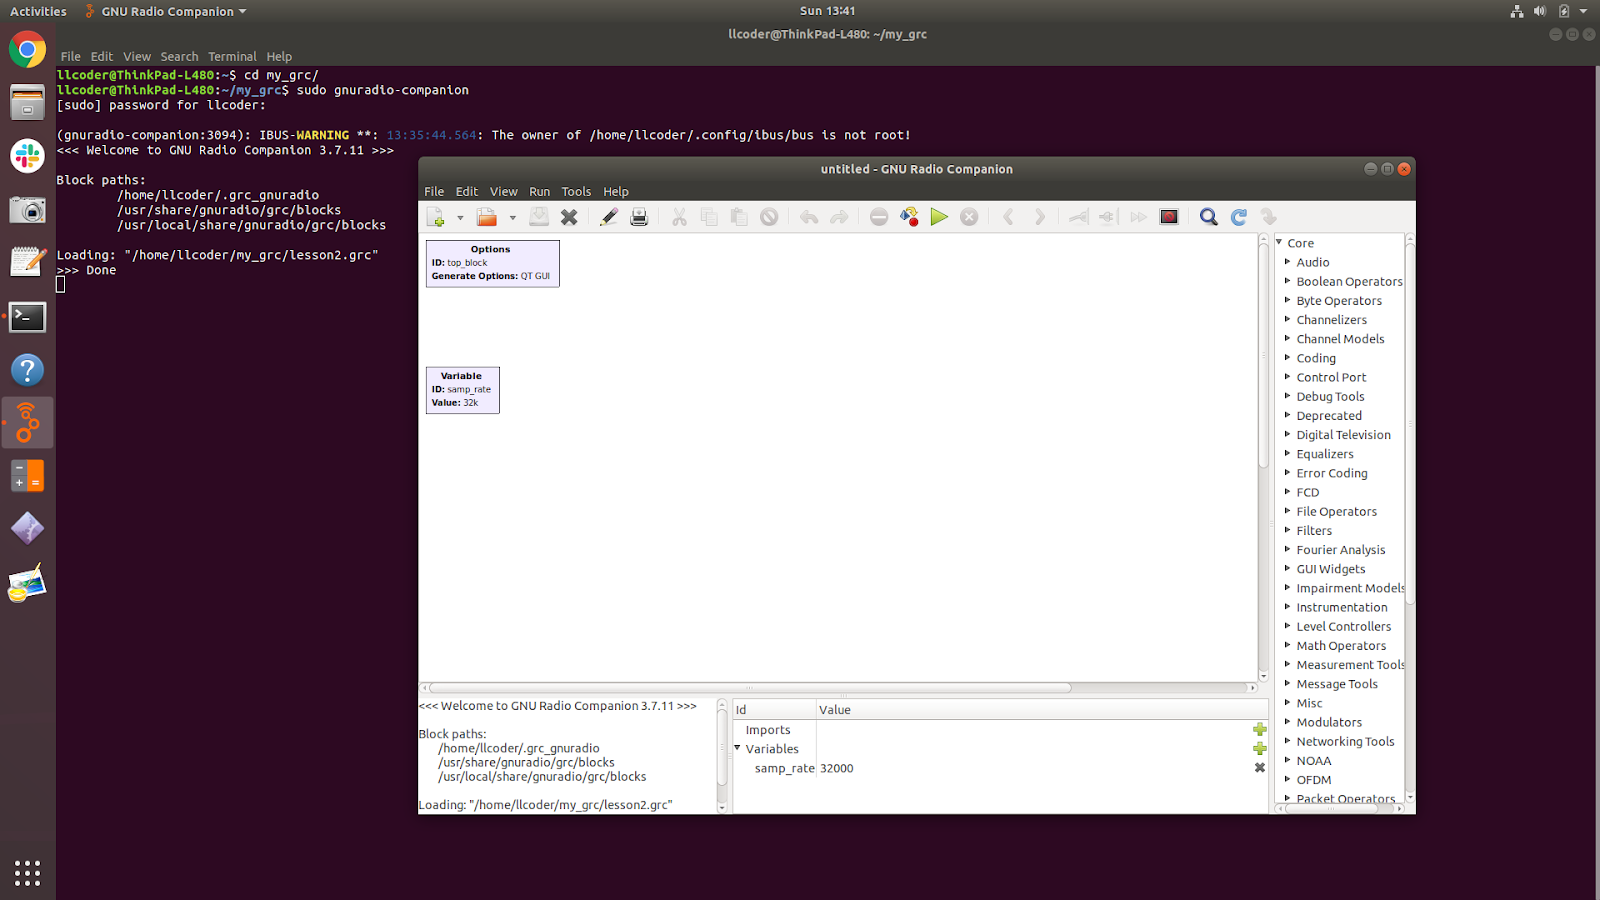
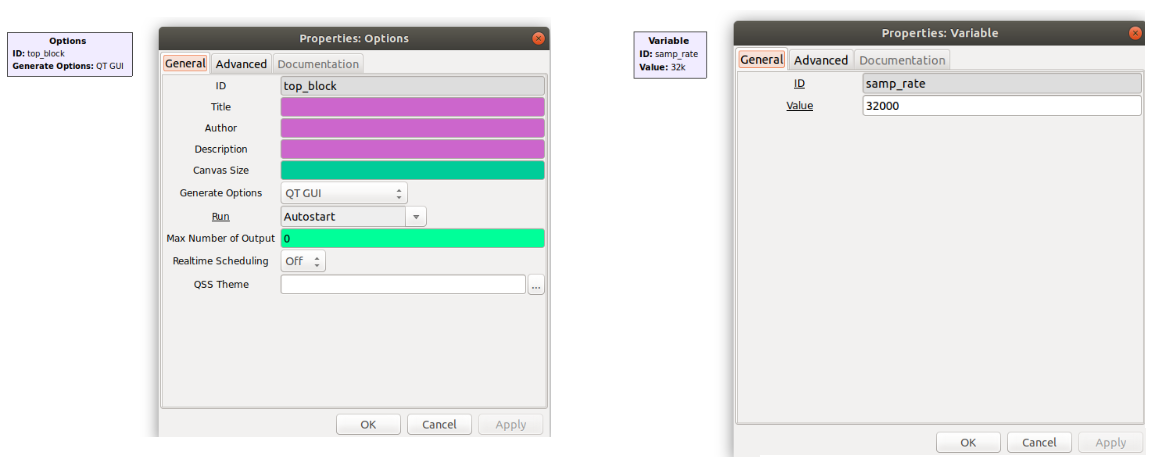
Notice that the new flow graph opens with two blocks already defined as Options and Variable. The Options (ID: top_block) defines the tool-chain library that we’ll be using: QT-GUI, WX-GUI, none, hier block, etc. and the Variable block (ID: samp_rate) is established to allow us to choose our signal sample-rate, defaulted to 32ksps (32 thousand samples per second).
Note: Right-mouse-click on any block to display the properties and to modify its parameters.
I’ll be using the HackRF (supported by the osmocom Source block), and the recommended minimum sample-rate when using the HackRF is 2M samples per second. I can select the osmocom Source by finding it and double-clicking on it in the list.
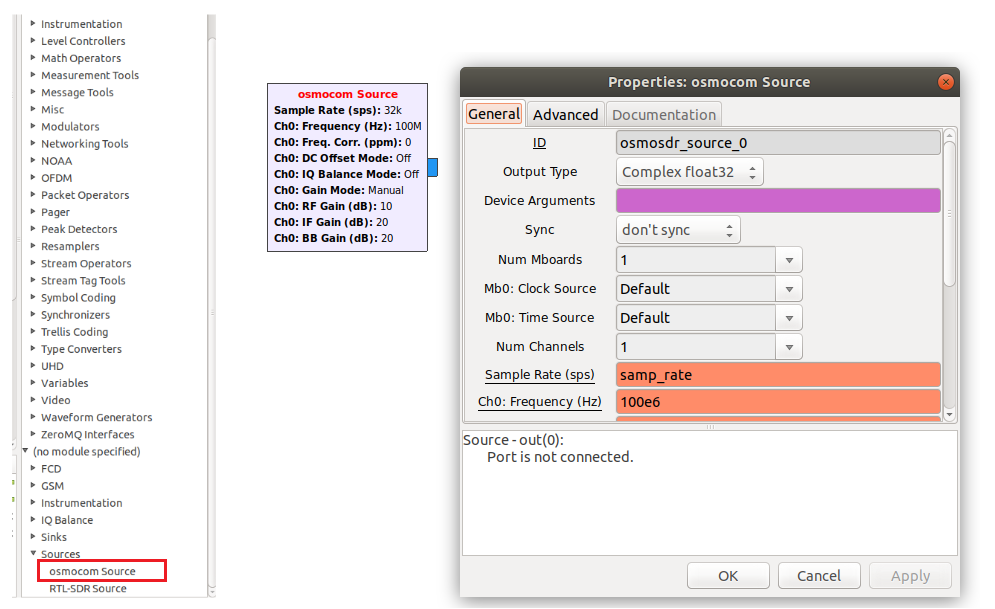
At this point, I might want to change the sample rate variable from the default 32k (32e3) to 2M (2e6). Any block in the flow graph that specifies the variable ‘samp_rate’ will now use the new (edited) value.
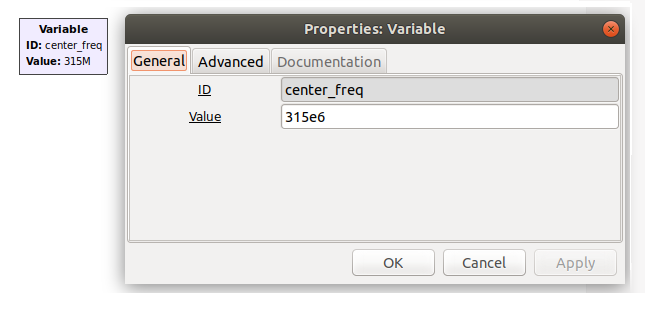
It would also be very helpful to have a variable for the desired (target) RF center frequency of 315Mhz (315e6). This can be accomplished easily by copying and pasting the ‘samp_rate’ variable block, and naming the new variable block ‘center_freq’.
I can now right-mouse-click on my osmocom Source block, and change the default CH0 frequency (100e6) to now be the variable ‘center_freq’. My flowgraph now looks like this:
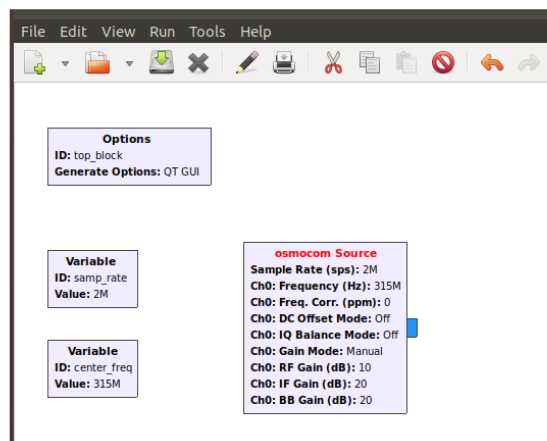
Notice that the two variables ‘samp_rate’ and ‘center_freq’ values are now being followed by the osmocom Source block. Defined variables come in very handy as flow graphs grow in size and readability becomes obscured.
Also, notice the blue colored output of the osmocom Source. The color blue indicates a complex value (real and imaginary) that will be provided at its output. If the output color were orange, then the output would be a real value (integer, float, absolute, etc). This is an important concept to be aware of. Input and output colors must match or an error will be thrown. Mismatches can be corrected by editing the Output Type or Input Type property of the offending block.
And lastly, notice that osmocom Source (ID) is displayed in red letters. GNU Radio uses red to indicate an error in the flow graph. In this case, the error is pertaining to the Source block missing its output connection. This will be satisfied when I add the output (sink) block and connect the two blocks together.
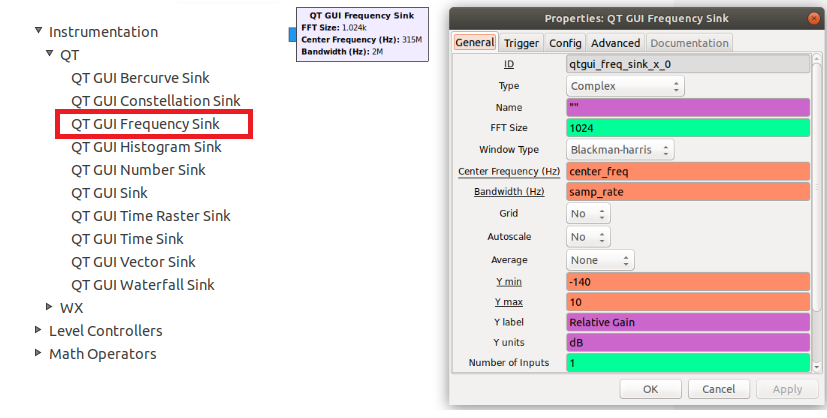
Creating the sink:
To complete my “preliminary” flow graph I need to add an FFT Sink so that I can monitor the signal activity and ensure that everything is working as expected. This can be accomplished by choosing the QT-GUI Frequency Sink block under Instrumentation. I need to enter the properties window and specify the variable ‘center_freq’ as the Center Frequency parameter. Also, I need to connect the output of osmocom Source to the input of QT-GUI Frequency Sink.
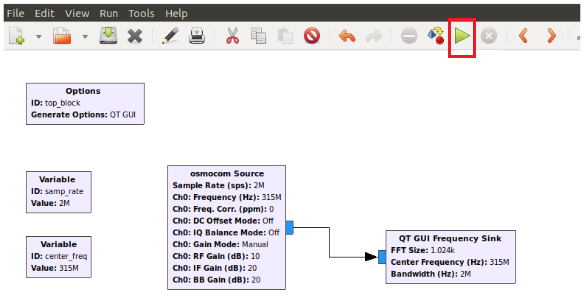
To execute my flowgraph I click the green Execute button.
Note: To stop execution click the red ‘X’ to the right of the green Execute button
This should open an FFT window displaying the 315MHz RF signal being received by the HackRF.
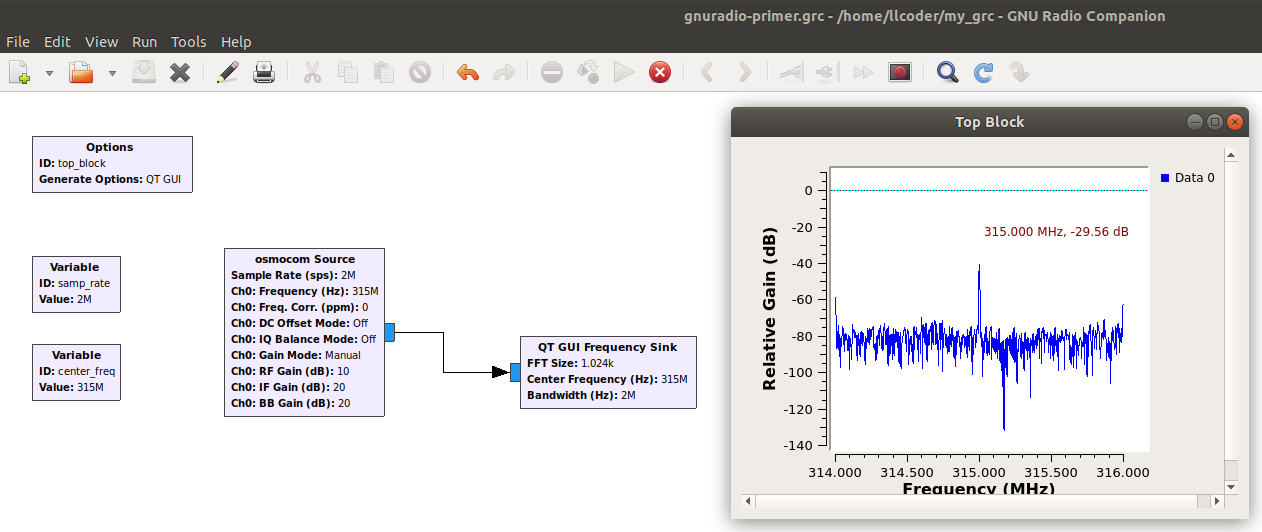
At this point, I can see that the flow graph is sampling a bandwidth of 2MHz with a center frequency of 315MHz. So far, it appears that the flow graph is working as expected.
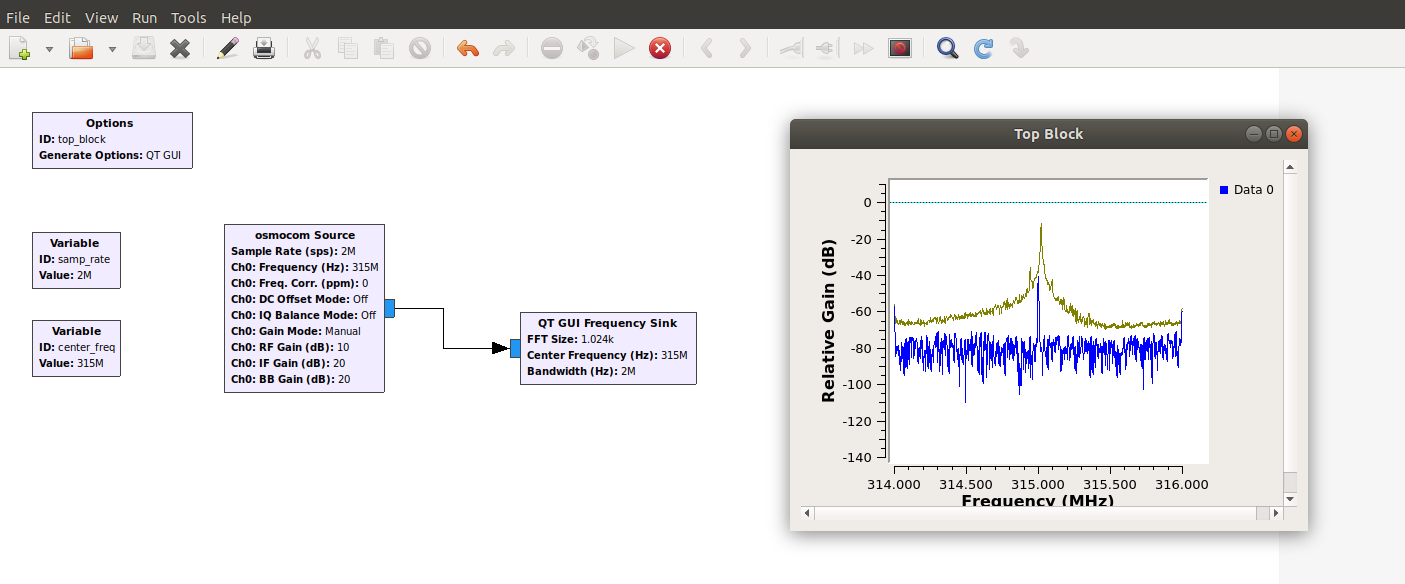
Next, I would like to be able to press the ‘unlock’ button on my FOB and display the resultant signal. This can be accomplished using the same flow graph, but first I need to go into the running FFT window and click the center button on the mouse. This opens a drop-down menu where I can select ‘Max Hold’. This feature will display any signal that is higher than the current signal being displayed.
Executing my flow graph with Max Hold enabled results in the following display when I click the FOB button:
Capturing the FOB unlock signal for replay:
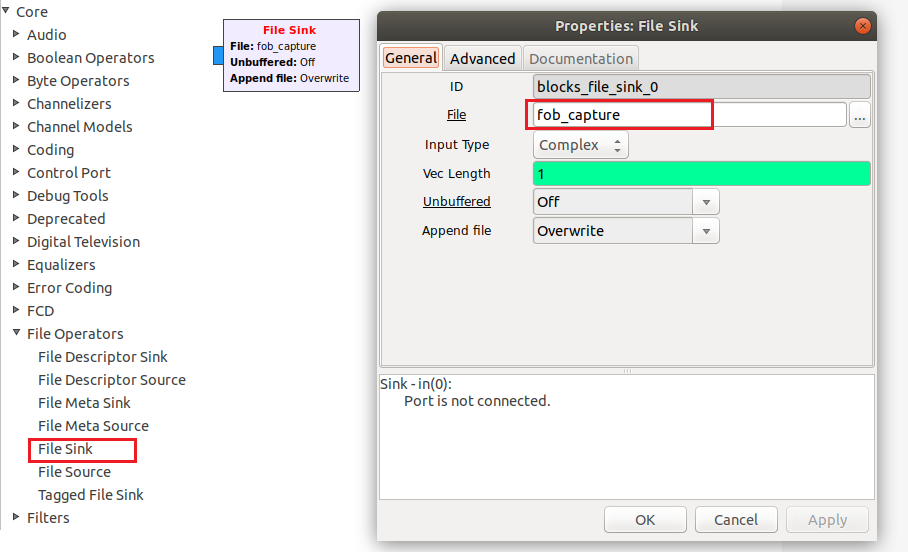
In order to capture the resultant FOB generated signal and save it to a file, I needed to include another Sink block (output) to my flow graph. This new block can be found under File Operators and is called File Sink. Right-mouse-clicking allows me to open the properties window and enter a filename for the captured raw data. I chose to name this file ‘fob_capture’.
Note: These files can get quite large very quickly, as we will be sampling 2 million samples per second using floating-point notation. For this reason, I will execute the flow graph, click the FOB button, and then stop the flow graph as quickly as possible.
My modified flowgraph now looks like this:
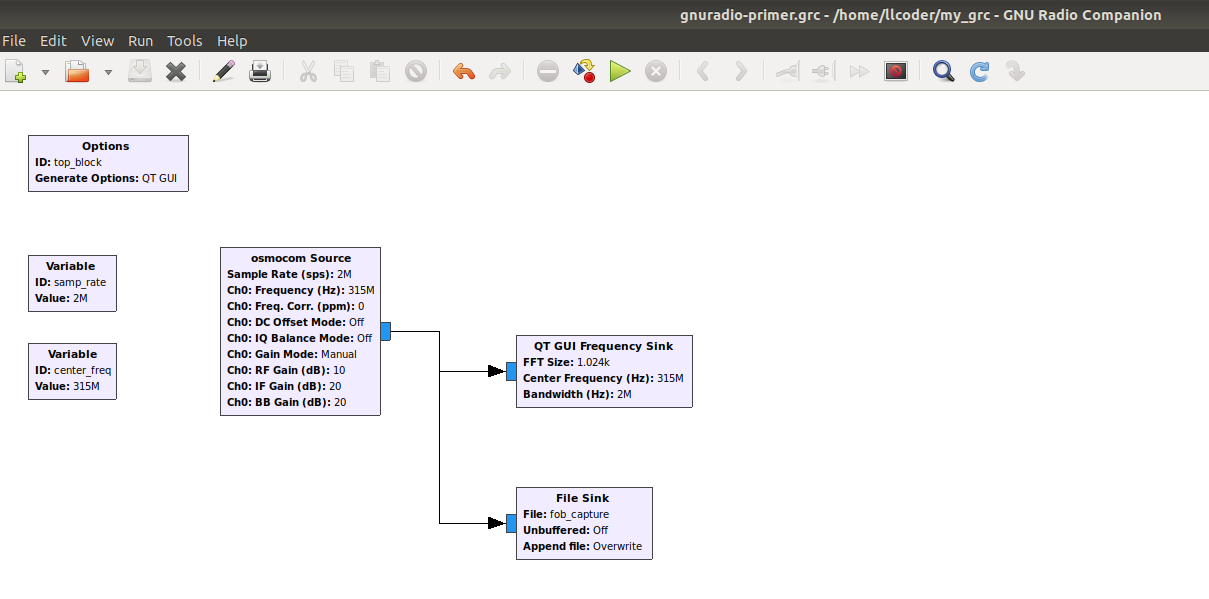
Executing the flow graph and capturing the FOB signal results in a 49.3M byte raw file.
Directory listing:
-rw-r--r-- 1 root root 49311744 Nov 10 21:06 fob_capture
Replaying the FOB signal from the captured file:
Note: In GNU Radio, we can disable blocks from being executed by right-mouse-clicking the block and selecting ‘Disable’ from the drop-down menu. This will display the block as grayed out indicating that the block is temporarily removed from the flow graph execution.
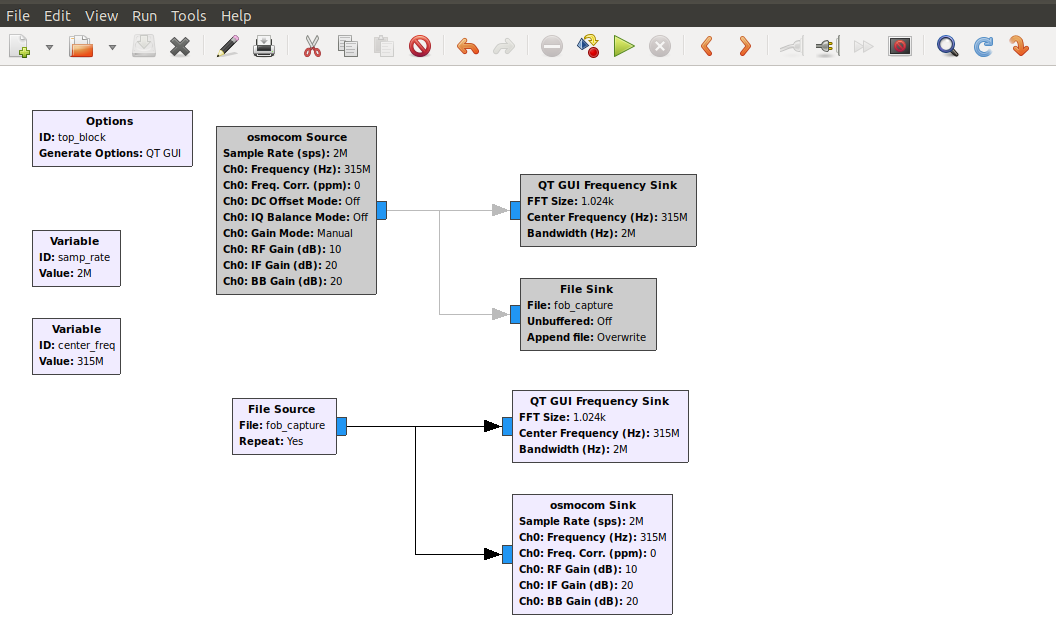
To replay the captured signal we might have normally created an entirely new flow graph, however, to demonstrate the ‘Disable block’ feature, I decided to just disable the osmocom Source, QT GUI Frequency Sink, and File Sink blocks. After being disabled, the three blocks are now grayed out.
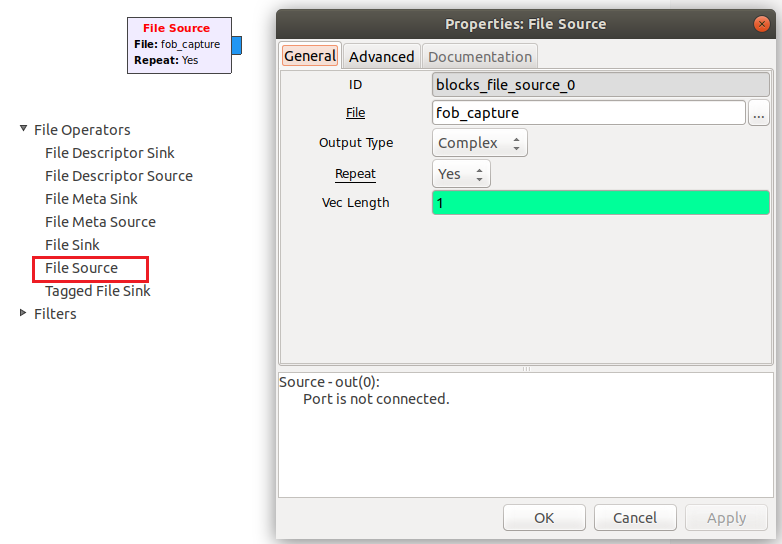
Next, I created a new source block using the File Source block under File Operators. I opened the block properties and entered the name of my previously captured file, ‘fob_capture’.
I then created a duplicate (copy and paste) of the previously used QT-GUI Frequency Sink (FFT) block, so that I could watch the signal being replayed.
The final thing I did was to use an osmocom Sink block to actually transmit the replay signal using the HackRF.
My modified flowgraph now looks like this:
The following video (taken with my phone) shows the results of executing this flow graph:
Note: The ‘Repeat’ parameter in the File Source block indicates that the file will repeat (in an endless loop). Ideally, we would only allow the signal to be played one time in a replay attack, but for demonstration purposes, I chose to repeat the replay.
Other useful GNU Radio information:
If you have had any previous experience using hardware equipment, such as oscilloscopes, frequency generators, frequency counters, spectrum analyzers, etc., it’s good to know that this equipment can be added to your flow graphs to further supplement your project development and testing.
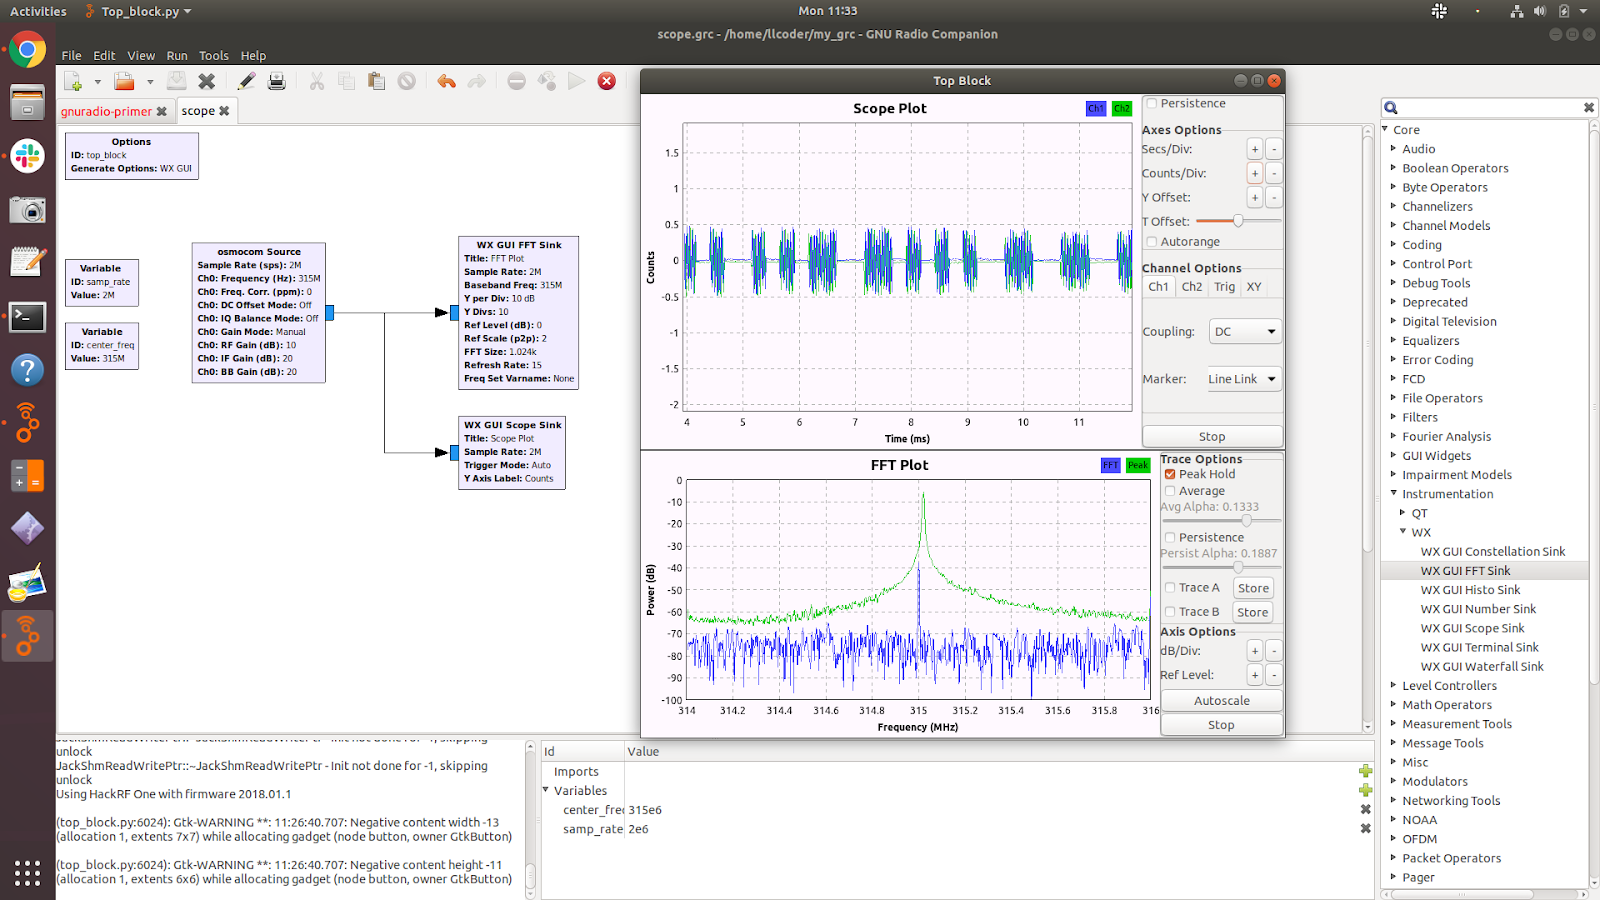
The following demonstrates using an oscilloscope ( to lock into the actual captured FOB signal at a much lower level, showing the actual digital pulses (making up the code). Although this level of information is not necessarily required for a replay attack, it is good to know the options are available.
Also notice, I’m using the WX-GUI library to demonstrate using the scope block, rather than the QT-GUI library used earlier.
Throttle block (when and why):
Also worth mentioning, is the Throttle block which can be found under the ‘Misc’ category in the list. The Throttle block is typically attached directly to the output of a “non-hardware” source block (Signal Source block, etc), in order to limit the rate at which that source block creates samples. We would use the Throttle block to throttle the flow of samples such that the average rate does not exceed the specified rate (samp_rate).
A throttle block should be used if, and only if, your flow graph includes no rate limiting block, which is typically hardware (SDR dongle, speaker, microphone, etc.). For example, a Throttle block could be used in a flow graph that is simulating actual hardware but with the absence of an actual clock.
In the following example flow graph, if we remove the Throttle block, the output will look the same, but our CPU will be at 100% and GNU Radio might crash. This is a good example of when to use a Throttle block.

It should also be noted that the “throttled” sampling is not intended to be very accurate in precisely controlling the rate of samples. This needs to be controlled by a source or sink tied to sample clock (USRP or audio card), in which case a Throttle block would not be used.
Generally speaking, a Throttle block is normally not necessary and should be avoided especially when using a hardware source (USRP, SDR-RTL, etc.) clock. This is because a Throttle block is a bad clock and generally leads to a two-clock problem and potentially very bad results can occur. The rule-of-thumb is if the flow graph has a radio device (USRP, SDR-RTL, etc.) OR audio device (sound card, etc.) connected, DO NOT USE a Throttle block.
Summary:
As stated at the top, although I was able to capture the unlock signal from my FOB and replay that signal, I still consider the effort a win (even if I didn’t actually unlock the vehicle with the replay).
Going forward, new RF (radio frequency) related projects will, no doubt, present itself. New vulnerabilities will be exposed. Armed with the ability to emulate expensive radio hardware through software (flow graphs), GNU Radio will always be a valuable tool to have in my arsenal.
It’s a cat and mouse game for sure, but thanks to the InfoSec community’s constant research and contributions, we can continue to share our knowledge and strive to keep our systems secure.
Ready to learn more?
Level up your skills with affordable classes from Antisyphon!
Available live/virtual and on-demand