Initial Access Operations Part 1: The Windows Endpoint Defense Technology Landscape

Security Consultant, Malware Researcher, New Technology Researcher Evangelist.
Today’s endpoint defense landscape on the Windows desktop platform is rich with product offerings of quite sophisticated capabilities. Beyond the world of antivirus products, Extended Detection and Response (XDR), and complementary behavioral analysis approaches provide a broad coverage of both initial access malware techniques, as well as post exploitation activity detection.
Anybody participating in Red Teaming activities today will tell you that gaining initial access through the execution of some binary artifact is much harder now than ever before. Even if access is gained on a Windows desktop platform, post exploitation activities by common command and control platforms are well studied and with well-instrumented defense responses in mature environments.
This enhanced endpoint defense posture has resulted in both Red Teamers and Threat Actors shifting tactics to other vulnerable areas such as cloud resource misconfiguration, team collaboration tools, software developer supply chains, and the ever-present credential (mis)management challenges that persist across 0road array of information technology solutions.
The defensive technique/technology list below is focused on defense product techniques with brief mention of integrated Windows features. There exists a host of other Windows Operating System security features, such as: Address Space Layout Randomization (ASLR) , Data Exception Prevention (DEP), and Control Flow Guard (CFG), for example, which is not the focus of this article.
Examples of defense technique coverage include items such as the following:
- Static artifact analysis
- Event tracing for Windows
- Windows kernel notification callbacks
- Windows DLL API hooking
- Process Tree Analysis
- Memory Page Scanning
- Call Stack Tracing
- Windows 10/11 hardware enforced stack protection
- Kernel driver block listing
I won’t bother speaking about static artifact analysis too much, since it’s fairly self-evident, given entities like Virus Total and the like. Briefly, it is true to say that any static artifact with a high entropy score, i.e. large amounts of embedded encrypted data, will likely drive an immediate detection from most products. Having said that, let’s cover some of these other techniques.
Event Tracing for Windows (ETW)
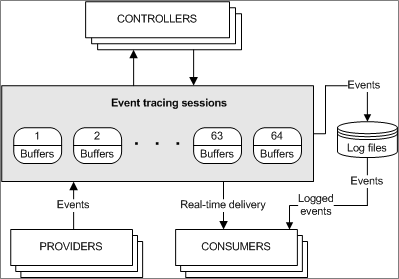
This technology implements tracing and event logging for both user mode applications and kernel driver activities. The Windows Event Tracing API is implemented in three components:
- Controllers which can start or stop event tracing sessions.
- Providers which supply the event data itself
- Consumers which consume the event data
Source: https://learn.microsoft.com/en-us/windows/win32/etw/about-event-tracing
There are three types of providers, Managed Object Format (MOF), Windows software trace preprocessor (WPP), and finally trace logging, which is what provides the ETW logging. Needless to say, if you subscribe as a consumer to ETW data, you will receive a huge volume of trace logging, which includes almost any Windows API call that can be made by an application and is quite literally a “fire hose” of information.
Windows Kernel Notification Callbacks
Back in the bad, old, Wild West days, many defense products would place redirection hooks into the System Service Descriptor Table (SSDT) to receive the necessary telemetry on application activities. Microsoft (rightfully) decided that they didn’t particularly like this technique, since any small 3rd party developer software defects could (and did) result in destabilizing the Windows kernel. When Windows Vista was released, Microsoft released an accompanying change called Patch Guard (Kernel Patch Protection) which enforced that 3rd party vendors could no longer place hooks into the SSDT among other things.
As you can imagine, many of the defense vendors did particular like the idea of a loss in telemetry, and thus, Microsoft did provide a feature called Kernel Notification Callbacks. This feature has been steadily enhanced since its initial release.
Kernel Notification Callbacks allowed a signed kernel driver to register a callback routine in order to receive notifications. At a high level, the different notifications include:
- PsSetCreateProcessNotifyRoutine
- Registers a callback routine for process creation events
- PsSetCreateThreadNotifyRoutine
- Registers a callback routine for thread creation events
- PsSetLoadImageNotifyRoutine
- Registers a callback routine for image load events
- ObRegisterCallbacks
- Registers a callback routine for object changes such as when a process, thread, or desktop handle is opened or duplicated.
- CmRegisterCallback
- Registers a callback routine for any Windows registry operations
Given this granularity of notification information, it should be no surprise that defense vendors used signed drivers that will leverage a number of the above notifications.
The advantage of doing this at a kernel level is a smaller chance of malware tampering with the callback registration or data. Although be aware that signed and vulnerable kernel drivers exist that are not on the block list, which presents a risk of tampering.
Windows DLL API Hooking
API hooking has long been a technique to redirect code execution in a Windows user mode process. This can be performed on almost any loaded image/module in a process, but is, however, most commonly performed on “ntdll.dll”, which is always loaded along with “kernel32.dll” and now “kernelbase.dll”, in all application processes.
The Windows Native API is a set of application programming interfaces used in the Windows operating system. “ntdll.dll” is a dynamic-link library that contains a collection of functions that are part of the Windows native API. “ntdll.dll” system calls (syscalls), are low-level functions that provide an interface between user-mode applications and the Windows kernel.
When a user-mode application needs to perform a privileged operation or interact with the operating system’s kernel, it makes a system call. Instead of directly invoking kernel functions, applications call functions within “ntdll.dll”, which in turn, makes the necessary system calls to the Windows kernel.
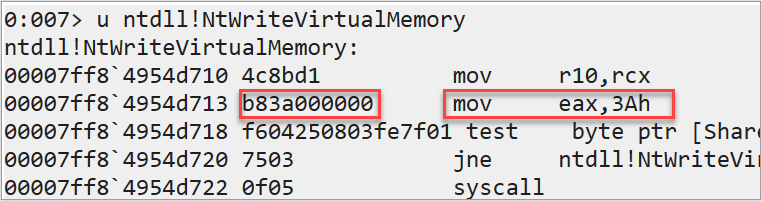
Let’s look at an example of the “ntdll.dll” API call “NtWriteVirtualMemory()”. For the image below, I started up the Windows debugger (WinDBG) and a “notepad.exe” process (because we love picking on notepad). After attaching the debugger to the process, I disassembled the API call.
First note that this is a 64-bit process, and we are staying there because there is a dwindling amount of 32-bit systems these days anyway. The first two machine code opcodes below are doing the following:
- “mov r10,rcx”: save a copy of RCX in the R10 register
- “mov eax,<syscall number>: move the system call number into the EAX register. (EAX is just a 32-bit notation for the RCX 64-bit register)
- Next, there is a test to see whether we should be using the “int 0x2e” interrupt driven system call convention or the “syscall” instruction. Either way, a system call is going to occur!
Now, because we can open any process that we have the appropriate security token rights to open, we can also overwrite virtual memory in a process.
As it turns out, we can replace the second opcode with a JMP instruction to redirect the code to a new memory location. Conveniently, a 32-bit short JMP instruction fits nicely into the 5 bytes available to us.
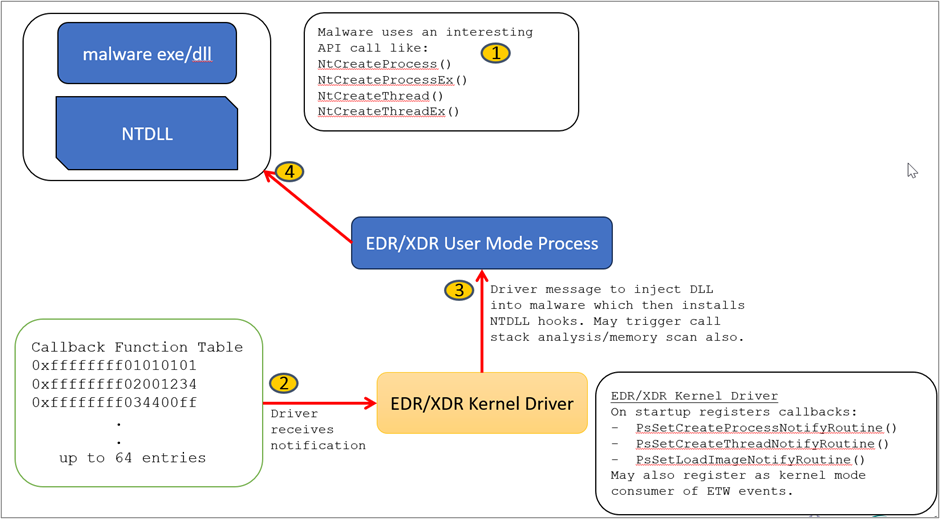
Overall, the sequence to hook an API in “ntdll.dll” for a defensive product might look something like this:
- The defensive product receives some kernel notification callback that it considers “interesting.”
- The defensive product opens the application process and injects into the process some code to load its own signed DLL module. Alternatively, the defensive product may be configured such that its own signed DLL module is loaded for all process creation, in which case, this step would be unnecessary.
- The defensive product finds the address of the “ntdll.dll” API of interest and overwrites the second opcode with a JMP instruction into code of the newly loaded DLL/module.
- Depending on the DLL loaded, some sort of defensive scanning actions or just further notification or even perhaps a direct blocking on the API call is made. If not blocked, the defensive product DLL will move the correct SYSCALL number into the EAX register and then JMP back to the SYSCALL instruction of the original API.[ME1]
“ntdll.dll” API hooking may or may not be implemented dynamically using kernel notification callbacks. In some instances, the defense product design might hook many of the “ntdll.dll” API’s upon an image load notification for all processes and leave them hooked for the lifetime of the processes.
Visually, the whole sequence can be represented as follows:
Process Tree Analysis
The idea here is to create an internal representation of the running processes on a system and their hierarchical relationships. The parent child relationship data can be compared with a set of static rules, and/or processed through an artificial intelligence model in order to identify abnormal outliers. A simple example might be to consider the PowerShell process as potentially suspicious if it is a child process of an Excel spreadsheet.
Memory Page Scanning
It is not uncommon for malware to allocate some pages of virtual memory, copy some machine code (shellcode) to that memory, set the page(s) to the PAGE_EXECUTE_READ permission and create a thread pointing to the start address of the memory allocated. Virtual memory is a memory management technique that provides an abstraction of the physical memory resource. On Windows, and many other operating systems, a page of virtual memory consists of 4096 contiguous allocated bytes.
The thread of execution created could be in the same running process that the malware started or could be injected into a foreign process accessed by the malware, assuming the security token of the malware process has sufficient rights to access the foreign process.
Defensive products can use the “ntdll.dll” API “NtQueryInformationThread()” to determine any process thread’s starting address. In addition, the kernel32.dll API “VirtualQuery()” or “VirtualQueryEx()” can be used to obtain allocated virtual memory properties. The “kernel32.dll” API functions ending in “Ex” are typically those which can access a tertiary process using an open process handle as opposed to the local process. It is also possible to use the “ntdll.dll” API call “NtReadVirtualMemory()” to directly examine memory contents itself.
Some easy detection opportunities arise from memory page scanning:
- If virtual memory is allocated and protections are set to READ, WRITE, and EXECUTE, then it is pretty much guaranteed to be malicious.
- The reason that READ, WRITE, and EXECUTE permissions on virtual memory pages is an indicator of compromise is related to how virtual memory is used in a typical Windows process. Executable machine code in say the “.text” section of a PE/COFF executable will typically be mapped into virtual memory pages set to READ and EXECUTE only.
As the code in a process executes, memory is going to be modified either on a thread’s stack or the heap, with some additional fixed symbolic information mapped from the “.data” section of a PE/COFF module. In these use cases, we typically will see either READ ONLY permissions on virtual memory pages or READ/WRITE permissions.
- The reason that READ, WRITE, and EXECUTE permissions on virtual memory pages is an indicator of compromise is related to how virtual memory is used in a typical Windows process. Executable machine code in say the “.text” section of a PE/COFF executable will typically be mapped into virtual memory pages set to READ and EXECUTE only.
- If virtual memory is set to READ and EXECUTE and the memory is not backed by a DLL module image load when the thread is created, it is likely malicious.
- Commonly used shellcode, like those in the Metasploit project, Cobalt Strike, and others, have distinct known memory patterns that can be directly matched. Detection methods have also included heap allocation scans for Cobalt Strike profile data for example.
Note: A related offensive evasion technique is to encrypt any heap data when a C2 client shellcode goes in/out of sleep mode.
Call Stack Tracing/Analysis
Whenever a process thread is created, a region of memory is always allocated for the thread’s stack. The stack is organized into stack frames whereby every function call creates a new frame. A stack frame will contain local variables belonging to the specific function, as well as a function return address.
As any code in a thread executes, its stack will grow and shrink as various functions are called. This means that at any point in time, the thread’s stack (sometimes referred to as the call stack) has a trail of evidence showing the sequence and depth of function calls.
Defensive products can use a kernel callback to trigger “call stack analysis,” which will unwind the call stack and most often check to see if any function calls were made from memory not backed by a DLL module/image loaded from disk.
A related concept to this is exception handling information in which the “.pdata” section of a 64-bit PE/COFF image contains function table entries containing exception handling code on a per function basis.
From an offensive perspective, it is possible to write fake information into the call stack, making it look like all function calls are completely legitimate. This act will evade/defeat call stack tracing defenses.
Windows 10/11 Hardware Enforced Stack Protection
With the introduction of Windows 11, and appropriate processor support, there exists a new defensive technique called Hardware Enforced Stack Protection. This feature will only work if the underlying processor provides support, such as Intel’s Control-flow Enhancement Technology (CET) or AMD’s shadow stacks.
In short, for all running processes, the return address of any function call is pushed onto both the process thread’s call stack as well as a shadow stack maintained by the processor. Whenever a return instruction (RET) is encountered, the return addresses on both stacks are compared. If the addresses do not match then a control protection exception is issued. This exception is caught by the Windows kernel which in turn will terminate the offending process.
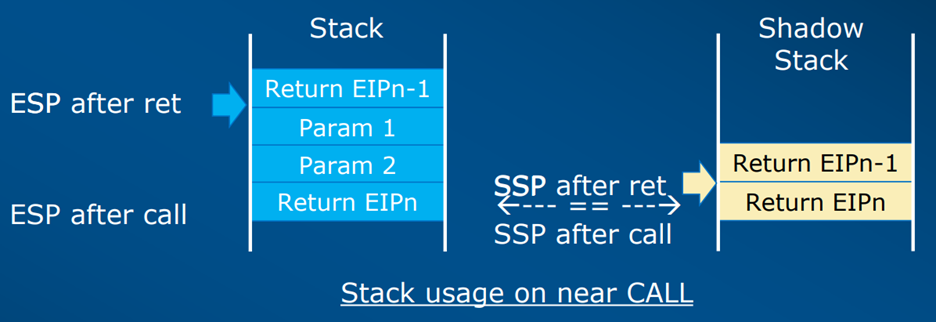
Using shadow stacks for comparing function return addresses provides a defense against Return Oriented Programming (ROP) gadget use, as well as any attempt to fake a call stack thereby making any call stack analysis more effective.
Within the same suite of protections, Intel has also implemented Indirect Branch Tracking (IBT), which is focused on defeating both Jump and Call Oriented Programming (COP/JOP) attack methods.
Kernel Driver Block Listing
One of the more attractive attacker targets that exists in the Microsoft Windows kernel environment is a signed driver that has a vulnerability. With direct access to kernel memory via a vulnerable signed driver, any kernel mode data structure can be modified, including the ability to disable signed driver enforcement and load any custom driver that the attacker wishes to.
If a vulnerable driver already exists on an endpoint, some custom user mode application code can be written to exert control over that driver and perform further exploitation. If an attacker has privileges on a system, then an approach known as Bring Your Own Vulnerable Driver (BYOVD) can be used to install a driver for further exploitation. Once any level of control is established in the kernel, system security is completely compromised with no limits other than imagination for attacker capability.
Unfortunately, driver development is a non-trivial endeavor, and there is a lot of code sharing that occurs in the community. On top of this, there are numerous devices and drivers going back in time that are used in different environments. This is a rich area of exploitation for threat actors today.
As such, with the introduction of Windows 11 as of the 2022 update, Microsoft has enabled the vulnerable driver blocklist. Microsoft runs a program for vulnerable driver submissions, and updates the vulnerable driver blocklist with each major release of Windows (about twice a year). Microsoft also provides a way to manually update the list using the Windows defender application control policy.
Unfortunately, the Microsoft blocklist is far from comprehensive, and as you might imagine, it is very difficult to adequately maintain such a resource with so many devices and drivers in existence. Thus, there still exists many vulnerable and signed drivers today which are being actively exploited. Furthermore, there are lists of vulnerable drivers that are made available online. One of these is here at https://www.loldrivers.io/
Conclusion
The list of techniques and descriptions above should now give you a good sense of why it is increasingly difficult to achieve a foothold on a Windows endpoint and perform post exploitation activities in a maturely instrumented environment. Having said that, initial access operations for Red Teamers are not impossible, just dependent on more sophisticated mature artifact generation techniques. In my opinion, achieving this requires an offensive DevOps approach. This is described in the next blog post, entitled “Initial Access Operations Part 2 – Offensive DevOps” (coming soon!).
Be sure to tune in next Thursday, 2/29, at 1pm EST for Joff’s webcast:
Exploring the Python “psutil” Module Under Windows w/ Joff Thyer
Learn more and register HERE!
You can learn more straight from Joff himself with his classes:
Regular Expressions, Your New Lifestyle
Enterprise Attacker Emulation and C2 Implant Development
Available live/virtual and on-demand!