Welcome to Shark Week: A Guide for Getting Started with Wireshark and TShark
In honor of Shark Week1, I decided to write this blog to demonstrate various techniques I’ve found useful when analyzing network traffic with Wireshark, as well as its command-line utility, TShark. For years, Wireshark has been the de facto tool for analyzing captured network traffic. It has extensive capabilities to decapsulate (break apart) the various layers of network traffic, enabling analysis of network communication between two hosts. Use cases range from troubleshooting network connections to unraveling malicious threats within an environment, not to mention countless others in between.
Remembering back to the first time I ever opened a packet capture for analysis… I felt a bit like Marty McFly in Back to the Future II when he encountered the gigantic Jaws hologram.

Okay, maybe not that dramatic, but it was intimidating to say the least. I do remember staring at the screen thinking, “I have no idea what I’m even looking at… Where do I start? Where’s the evil? What does it all mean!?” If you are brand new to Wireshark, this blog won’t alleviate all encountered difficulties – like a recipe for mastering anything new, it takes a lot of time, patience, practice, and more practice. Akin to whenever someone asks me, “How do I get started in incident response?”; My reply, “Start doing incident response.”
However, before we jump into analyzing packets, there are a few housekeeping items that are worth mentioning.
First and foremost, make sure you’re using the latest version of Wireshark. Especially if you’re analyzing network traffic from untrusted sources and/or points-of-presence (i.e., raw internet traffic). The last thing you need during an incident response investigation is for your analysis machine to become an additional victim.
Although it’s true that Wireshark routinely experiences bugs and vulnerabilities, it is still one of the most popularly used network protocol analyzers in the field, and although these issues surface from time to time, the community that supports this tool addresses them quickly. The following wiki article provides more details on this topic: https://wiki.wireshark.org/Security
In short, keep your tools up to date and consider utilizing Wireshark from within a virtual environment, particularly when performing packet analysis on network traffic captured from untrusted zones.
Note: The current version of Wireshark was 4.0.7 when this article was published.
Display Formats and Settings
In this section, I’ll cover some of the common display formats and settings encountered with Wireshark.
Time Display Format
Time is one of the most critical components of any investigation, so it only makes sense that we start there. Wireshark supports several options for displaying the timestamp of a given packet. To view or change the Time Display Format, navigate from the main toolbar to: View -> Time Display Format.
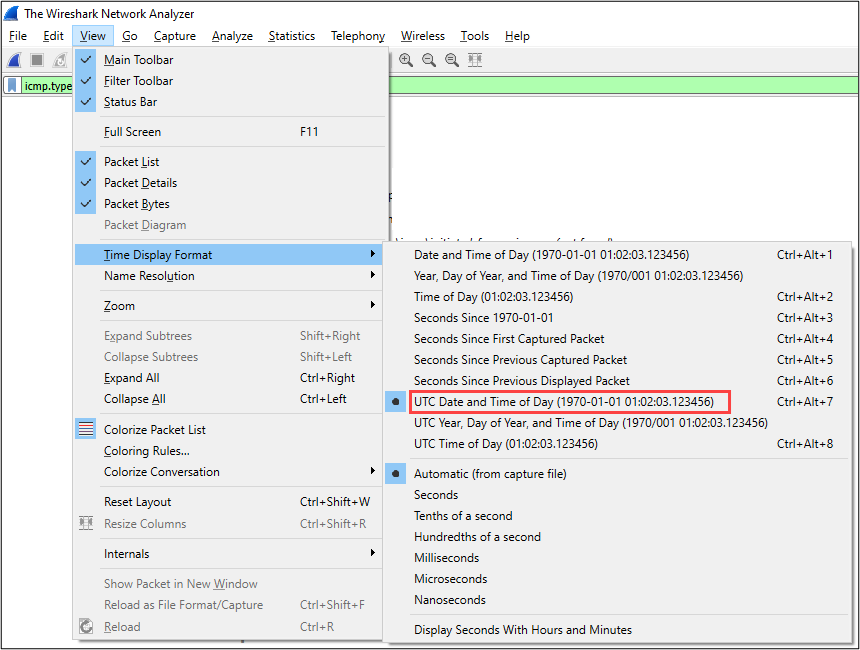
My preference is the UTC Date and Time of Day (1970-01-01 01:02:03.123456) option. One important note to mention about timestamps in packet captures – the timestamp is recorded at time of capture by the utility (and most likely the system time) from which the capture was taken. This may be a separate system from your analysis machine altogether, so ensure proper time synchronization is in place and routinely audited throughout your environment. A good resource on this subject is CISA’s guidance2 for managing time settings in an environment. Also, NIST maintains a list of Internet Time Servers3 that can be used to synchronize time over NTP (Network Time Protocol).
Name Resolutions
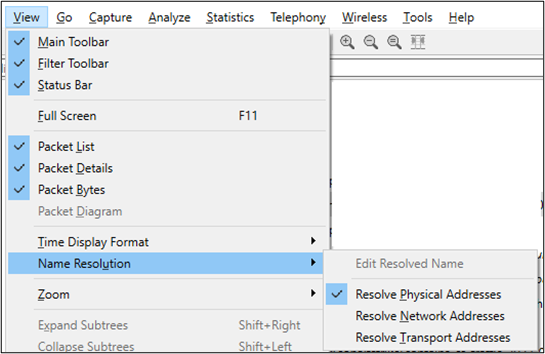
There are three areas where automatic name resolutions can be performed by Wireshark. These settings are accessed from the main toolbar: View -> Name Resolution. In the most recent install (version 4.0.7), the only setting enabled by default was Resolve Physical Addresses.
Depending on the scenario, these automatic resolutions may be helpful to an analyst; however, they do have the potential to thwart analysis or even lead to OPSEC failures… let me explain a little more of what these settings do.
- Resolve Physical Addresses (MAC OUI Resolution) – Wireshark translates the first three octets of a MAC address (also known as OUI or Organizationally Unique Identifier) to the assigned vendor name.
- Resolve Network Addresses (Reverse DNS Resolution) – Wireshark performs reverse DNS lookups on source/destination IP addresses.
- Resolve Transport Addresses (TCP/UDP Port Association) – Wireshark associates TCP/UDP ports to their assigned application protocols (i.e., TCP/80 – HTTP, UDP/53 – DNS).
Resolve Physical Addresses
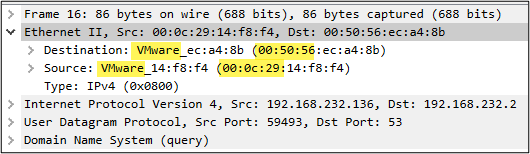
With Resolve Physical Addresses selected, Wireshark will translate the OUI (first three octets in the MAC address) to its assigned vendor. As shown in the Packet Details section of a packet below, the octets 00:50:56 and 00:0c:29 were both attributed to VMware. This aligns with the fact that I used a virtual host to generate packets for testing and performed the capture from a virtual network adapter.
Resolve Network Addresses
With Resolve Network Addresses selected, Wireshark will perform reverse DNS lookups on all Source and Destination IP addresses within the capture. Although this setting may seem convenient, it has the potential to “tip-your-hand” from an OPSEC perspective, especially if you’re performing packet capture analysis containing publicly routable IP addresses.
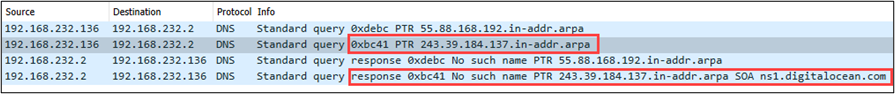
For demonstration purposes, I enabled this setting in Wireshark from within a virtual machine where the guest system was configured in NAT mode. I then captured traffic in/out of the guest OS while opening a packet capture file – the result: reverse DNS lookups were observed leaving the guest system. The below screen capture shows that Wireshark (from within the guest OS) was initiating reverse DNS queries for the IP 137.184.39.243, out to a public DNS resolver (not shown in the capture).
Resolve Transport Addresses
With Resolve Transport Addresses selected, Wireshark will tag each TCP and UDP port respectively with their commonly associated network protocol. For example, NTP (or Network Time Protocol) is commonly associated with both TCP/123 and UDP/123.
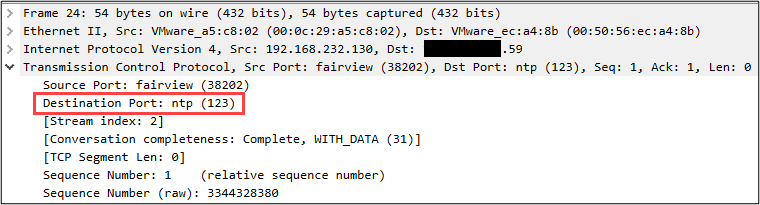
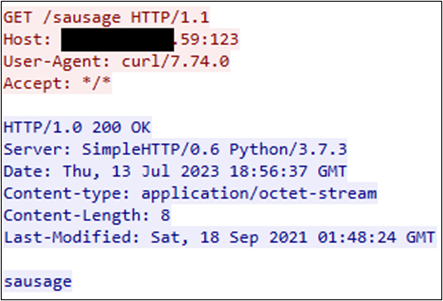
In the screen capture above, we can see in the packet details section where Wireshark tagged the Destination Port as “ntp”; however, if we peer into this conversation using the Follow TCP Stream feature, we can see that this is not NTP traffic, but rather HTTP.
In my opinion, the Resolve Physical Addresses this is the least [potentially] detrimental setting for analysis. There are cases where MAC address analysis is part of an investigation and a vendor lookup is helpful. The Wireshark community also maintains a website4 to perform bulk OUI lookups, which I’ve found to be very useful from time to time.
Resolving transport addresses can be misleading, especially if you are new to network analysis… my advice to anyone considering this feature is to treat it as informational and just be cognizant that anyone with full control of a system can utilize whatever TCP/UDP port they please. I do this all the time when testing egress controls for clients and it never ceases to amaze me the number of organizations that allow outbound traffic solely on the basis of the TCP/UDP port number.
Analysts should proceed with caution when it comes to the Resolve Network Addresses option. Perhaps there are use cases where this feature is value-add; however, I don’t believe the risk is worth the reward, and therefore I do not recommend it.
Display Windows
Wireshark uses three windows to display packet information – these windows are:
- Packet List – The topmost display pane where a high-level summary of each packet is displayed. By default, Wireshark displays: the packet number, packet timestamp, source/destination addresses, protocol, and description for each packet. The column headers can be reordered (right or left) and/or clicked on to sort (ascending/descending).
- Packet Details – The bottom-left pane (in older versions the middle pane) shows the details of the packet selected. Wireshark displays various fields in a hierarchical structure based on the selected packet’s TCP/IP layers.
- Packet Bytes – The bottom-right pane (in older versions the lowest pane) displays the selected packet’s bytes, represented in a hex dump with ASCII characters and an offset column, also represented in hex.
The screen capture below shows an example of each display with a packet capture file opened.
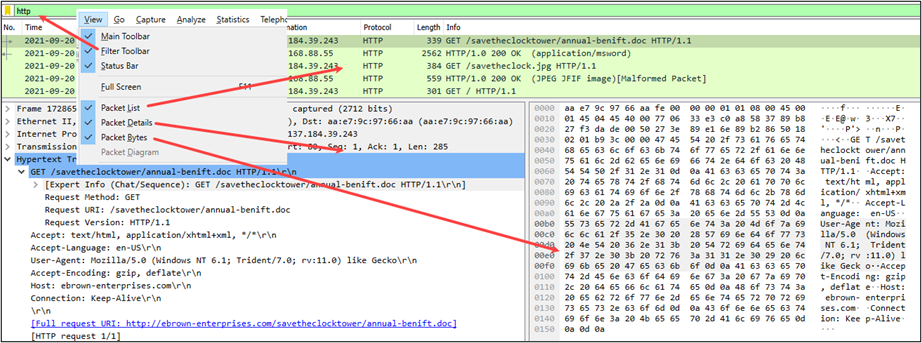
Note: In the screen capture above, the display filter toolbar has the ‘http’ filter applied. I’ll discuss more about display filters in a bit.
Capture Options
If you’ve been fortunate enough to never experience processing a huge PCAP file with Wireshark, consider yourself lucky… and when I say huge, I’m only talking 500MB+. Wireshark is an extremely powerful network protocol analyzer, but it is often painful to use against large packet captures. This next section will cover some techniques to help alleviate these pain points.
When utilizing Wireshark to capture network traffic, we can apply various capture options from both an input and output perspective. This helps limit the size of acquired data, which in turn aids our ability to analyze the traffic more swiftly. To access capture options, navigate to Capture -> Options… from the main toolbar.
Input: Limiting the Capture to a Target Host
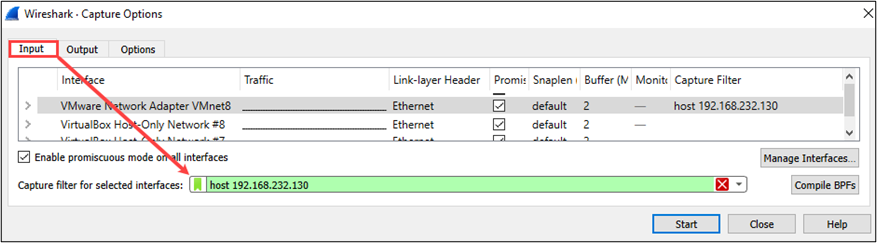
To limit the capture to a target host, we can use the following filter syntax:
host <ip_address_of_target_host>In the example below, I’m filtering on the IP address 192.168.232.130. This tells Wireshark to capture traffic where this IP is either the Source or Destination address.
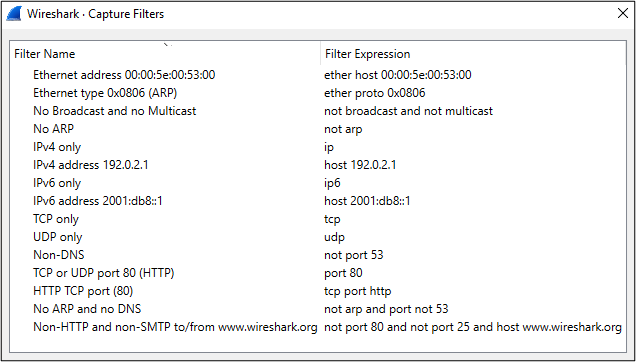
You can also view some prebuilt capture filters by selecting Capture -> Capture Filters… from the main toolbar. The Filter Expression column contains example syntax for applying each respective filter.
Output: Limiting the Capture Output
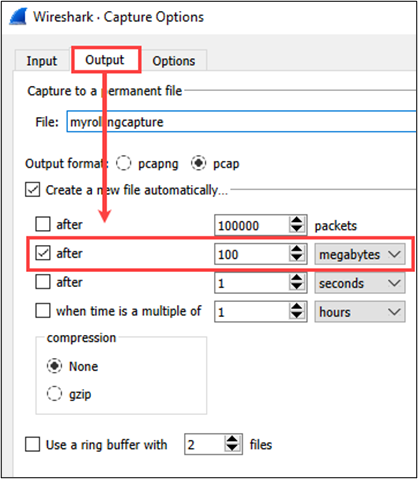
If the capture process is going to run for a long or indefinite period, it may be best to have Wireshark “roll” the output to a new file based on some provided criteria. The Output section/tab provides us with a few options here. We can tell Wireshark to save a new file after x-number of packets or bytes have been collected or some defined time derivative. Below shows an example where Wireshark is configured to write a new PCAP file each time the captured data hits 100MBs.
Display Filters != Capture Filters
Once a packet capture file is opened or otherwise generated with Wireshark, display filters can be applied to aid analysis.
Display filters are different than capture filters in that:
- Capture filters are only applied when capturing live network traffic.
- Display filters can be used during the capture process or when analyzing a saved PCAP file.
- During a live capture, Wireshark will continue to capture traffic regardless of any display filter applied – a display filter will limit the packets being viewed, but Wireshark will continue capturing traffic in the background, as defined in the Capture Options – Input tab.
The Display Filter Toolbar is located just above the Packet List window. Conveniently, Wireshark will populate a dropdown of display filter selections as you type in this field. This makes it less likely that an improperly formatted filter gets applied. Note: Wireshark will highlight the filter toolbar in red if the filter syntax is incomplete/invalid.
Many of the supported Wireshark display filters use a hierarchical syntax represented in dot-notation. For example, if we want to apply an HTTP-based display filter, but wish to be more granular in our selection, we can type: “http” directly followed by “.” Wireshark will then list all supported HTTP display filters.
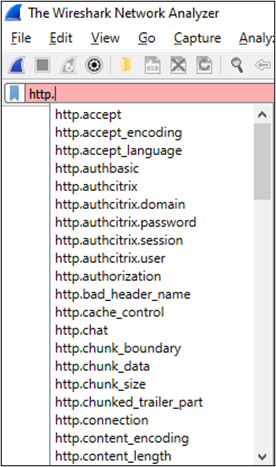
If you’re curious to know all built-in supported display filters, simply navigate to: View -> Internals -> Supported Protocols and view the filter column for the desired filter syntax. Shown below is just a portion of supported HTTP display filters.
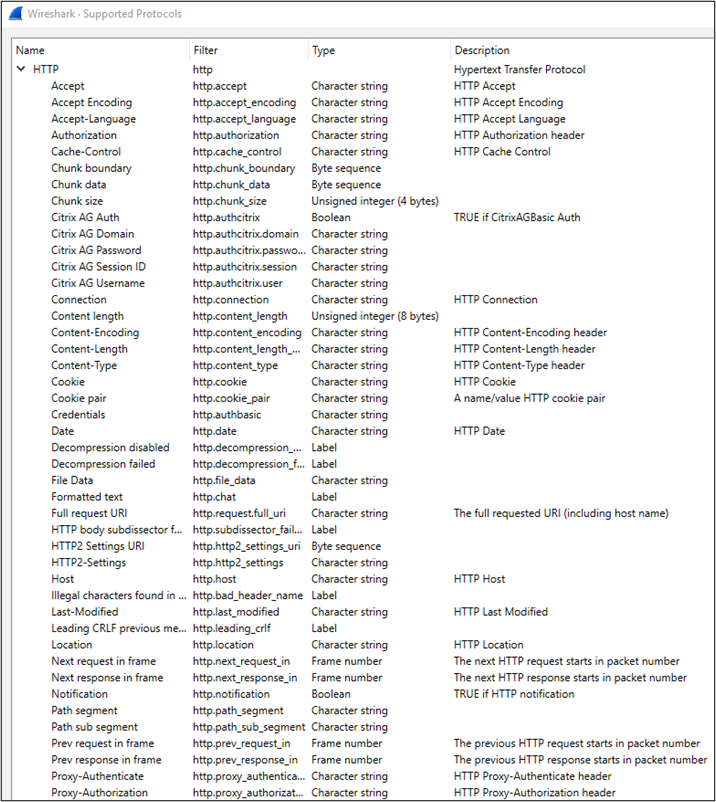
Wireshark currently supports over 218k display filters from nearly 3k protocols!
Follow the Streams
Viewing packet contents is one of the most powerful capabilities when it comes to network traffic analysis. The more context we have, the better informed we are during analysis. But that may be easier said than done when viewing captured network traffic at a per-packet level. Sure, we can select each packet and view the packet details and packet bytes sections within Wireshark, but that approach doesn’t scale well.
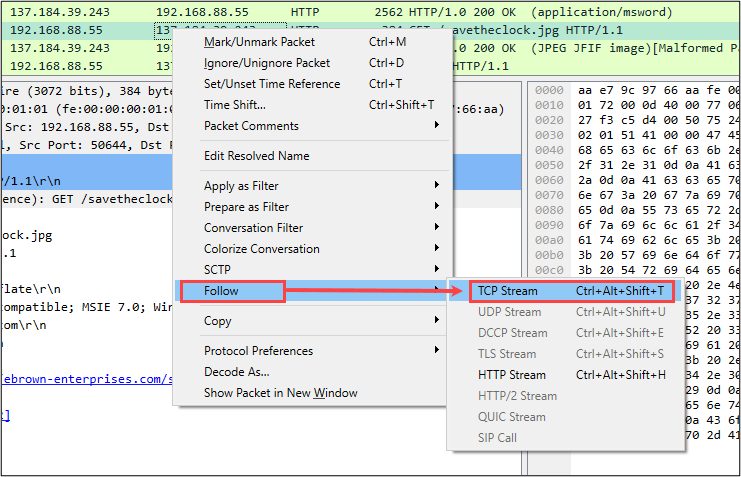
Fortunately, Wireshark provides us with the capability to view a given “Stream” of network traffic. Wireshark supports stream analysis over several different protocols – for this topic, we’ll be looking at TCP streams. To view a given TCP stream, right-click on a TCP packet in the Packet List display and select Follow -> TCP Stream.
Upon making this selection, Wireshark does two things:
- Displays the TCP stream in a new window.
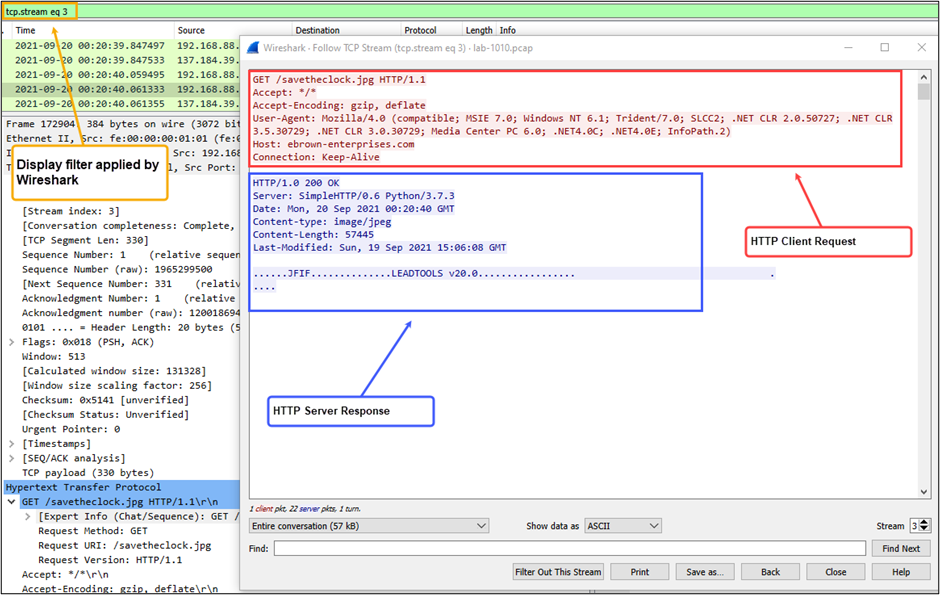
- Client data (host that initiated the connection) is color-coded in red.
- Server data (host that responded to the client request) is color-coded in blue.
- Automatically applies a tcp.stream display filter accordingly.
- Wireshark catalogs all streams on initial processing, with the first stream identified as Stream 0. As shown in the below screenshot, the display filter was tcp.stream eq 3 or in other words the 4th TCP stream in the capture file.
Extracting Objects
There’s nothing more satisfying to an incident responder than being able to extract attacker artifacts from network traffic. The specific email used as a phish – containing URLs and/or attachments, malicious file downloads, exfiltrated data, etc., etc.
Fortunately, Wireshark has a built-in capability that allows us to extract objects from network traffic. Unfortunately, Wireshark limits this capability to only a handful of protocols. We can see the supported protocols by navigating to File -> Export Objects.
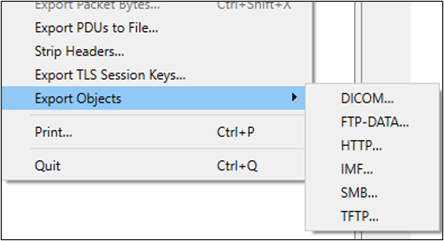
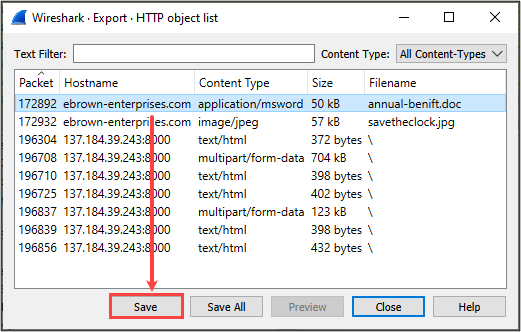
If you’re in a scenario where you have captured traffic containing threat activity, there’s an opportunity to extract file artifacts for a deeper dive into the content that was transferred over the network. To demonstrate, I opened a test PCAP file and navigated to File -> Export Objects -> HTTP…
We can see below where several “objects” have been identified by Wireshark – each one of them can now be extracted (saved to disk) for additional analysis.
Operationalizing from the Command Line
Now that I’ve covered some of the basic settings and features of Wireshark, I’ll show some practical use cases for operationalizing your analysis… yes, we are going to pivot to the command line using TShark, where we can do something useful rather than just staring into a GUI-abyss of packets!
In all seriousness, there is nothing wrong with doing your analysis from within Wireshark. In fact, I find it extremely useful to have an instance of Wireshark running while utilizing TShark. The difficult part with Wireshark is when we need to extract network data in bulk for things like data-stacking, generating network telemetry that can be fed into a SIEM, or any other analysis machine/process.
With TShark, we can harness the power of the command line while retaining the extensive protocol analyzers that come with Wireshark.
For starters, TShark needs some command line options. We’ll look at several useful ones here and I encourage you to read the man page5 and explore additional options as you get more comfortable.
To read in a PCAP file, we use the ‘-r’ option; I always couple this with ‘-n’ which tells TShark NOT to perform any name resolution shenanigans.
tshark -nr infile.pcap To apply a display filter, we use the ‘-Y’ option followed by the display filter.
tshark -nr infile.pcap -Y ‘dns’To write out a PCAP file, we use the ‘-w’ option. If we have a display filter applied, this will instruct TShark to save a new PCAP file with only the packets matching the display filter.
tshark -nr infile.pcap -Y ‘dns’ -w newfile.pcapAnd finally, to capture traffic with TShark, we use the ‘-i’ option to specify the interface to capture from.
tshark -ni eth0Without specifying any additional parameters, TShark will just print to stdout (standard output); therefore, we specify the ‘-w’ to instruct TShark to write a PCAP file. Additionally, if we want to apply a capture filter, the ‘-f’ option is used.
tshark -ni eth0 -f "host 192.168.20.10" -w test.pcapNow let’s see what this looks like in real life…
Applying the ‘http’ display filter to a pcap file, we get the following output.
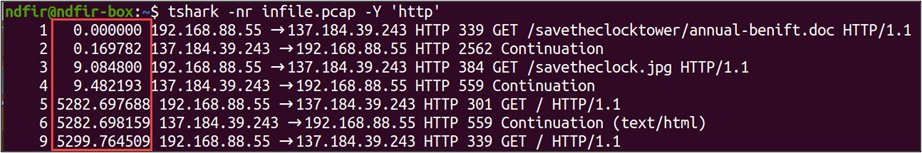
Note the timestamps are in relative seconds from the first observed packet.

We can fix this with the ‘-t’ option and ‘ud’ parameter which tells TShark to output the timestamp in UTC absolute time, in the format: YYYY-MM-DD hh:mm:ss.SSS
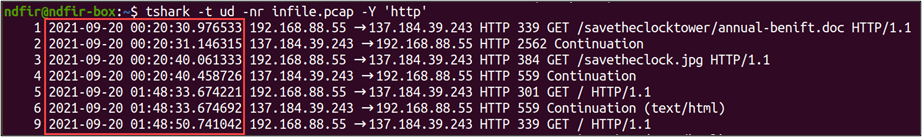
Much better!
Now let’s get dangerous and extract data fields from a PCAP file. TShark supports field extractions using the ‘-T fields’ option along with the ‘-e’ option to specify which fields are to be extracted.
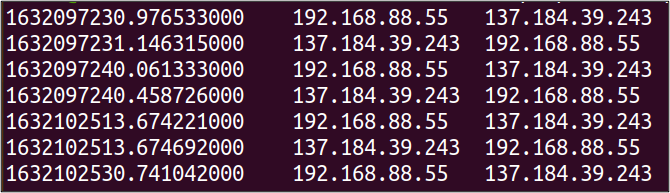
Here’s an example command that targets HTTP packets and prints out the timestamp (in epoch time), source IP address, and destination IP address.
tshark -nr infile.pcap -Y 'http' -T fields -e frame.time_epoch -e ip.src -e ip.dst By default, TShark will print to stdout with extracted field values as tab delimited.
We can customize the output a bit more by adding the ‘-E header’ and ‘-E separator’ options as shown in the following command.
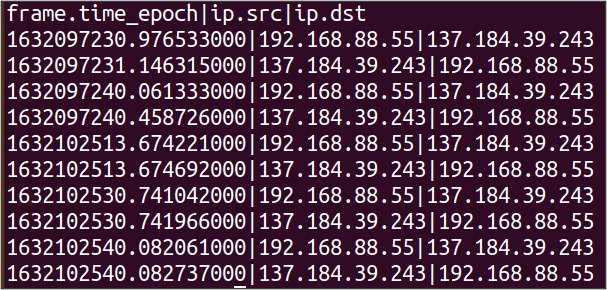
tshark -nr infile.pcap -Y 'http' -T fields -E header=y -E separator='|' -e frame.time_epoch -e ip.src -e ip.dst- ‘-E header=y’ instructs TShark to print the field name on the first line of output.
- ‘-E separator=’|’ instructs TShark to use a custom separator value, in this case the pipe character (|).
This is great, but you may be asking yourself, “how do I know the specific field name to target for extraction?” Well, this is where having a running instance of Wireshark comes in extremely handy!
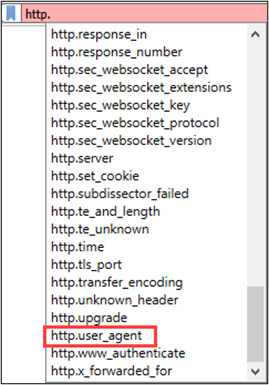
We can utilize the display filter trick in Wireshark and find the specific field(s) we’re after. For example, if we want to extract all HTTP User-Agent values with TShark, open Wireshark and go to the Display Filter Toolbar and start typing “http.” (don’t forget the ‘.’) – then scroll down until you find the User-Agent field name, http.user_agent.
I find it even more convenient to extract field names in the Packet Details section, then have Wireshark just tell me the specific filter syntax. This can be achieved by right-clicking on a field of interest and selecting Apply as Filter -> Selected.
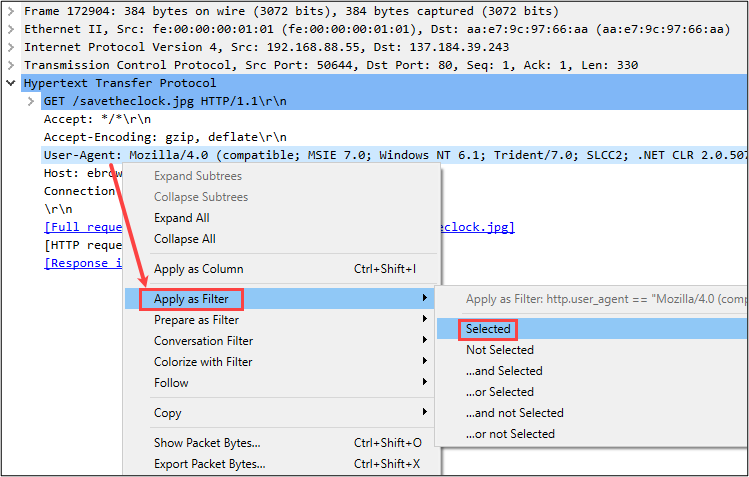
Viola… Wireshark will apply the filter in the Display Filter Toolbar for you!

Although the specific value is also applied to the filter in Wireshark, we can ignore that as we are only interested in the field name, http.user_agent. Now, we can take that to TShark and extract all unique User-Agent strings observed over HTTP.
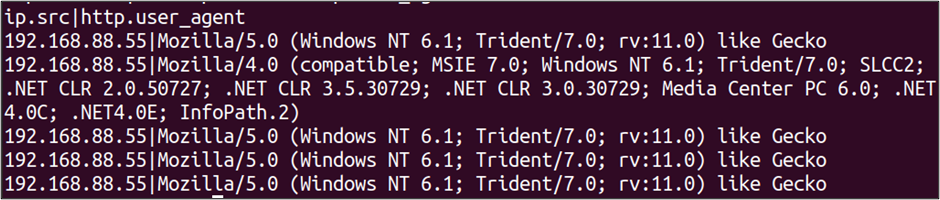
tshark -nr infile.pcap -Y 'http' -T fields -E header=y -E separator='|' -e ip.src -e http.user_agentThere is, however, a slight “gotcha” in the above command. As shown in the output below, each instance where the Source IP is 137.184.39.243, the User-Agent field is empty.
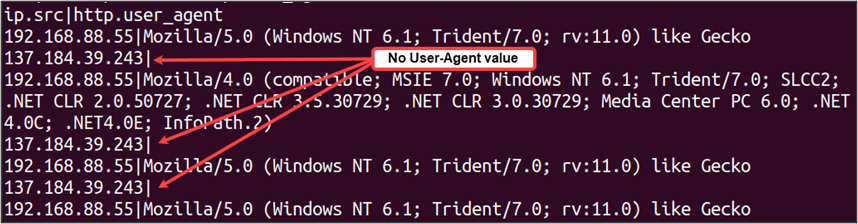
This is because we instructed TShark to extract fields based on the -Y ‘http’ filter, which returns all HTTP traffic – both client requests and server responses. In the HTTP protocol, User-Agent strings are sent by the client to the server, and since TShark applies filters on a per-packet basis, packets associated with server responses will not contain User-Agent values.
To avoid this, we need to be a bit more tactical with our filter and use http.request rather than just http.
tshark -nr infile.pcap -Y 'http.request' -T fields -E header=y -E separator='|' -e ip.src -e http.user_agentWith the above command applied, we now see that the only Source IP associated with User-Agent values is 192.168.88.55.
Because we are on the command line, we can redirect the output to perform additional actions on the extracted data. For these examples I’m using TShark on an Ubuntu system, therefore I can utilize additional utilities from there.
Suppose we wanted to extract all unique combinations of Source IP addresses and User-Agent values and determine their frequency of occurrence within a packet capture. We can modify the previous command slightly by redirecting the TShark output to the sort and uniq utilities, which are pre-installed on Ubuntu.
tshark -nr infile.pcap -Y 'http.request' -T fields -E separator='|' -e ip.src -e http.user_agent | sort | uniq -c | sort -nrThe above command results in the following output.
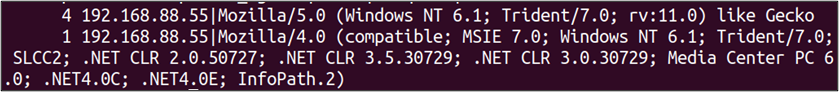
The results show that we have two unique User-Agent values in this packet capture file, and both are attributed to the host 192.168.88.55. The User-Agent string listed first was observed 4 times in the capture, while the second User-Agent value was seen once.
What does sort | uniq -c | sort -nr do, you might ask… well, the first sort command sorts each line prior to sending to uniq. This is needed because the uniq command only matches on adjacent lines. Then the uniq -c command counts each unique line value (this is where we get the counts 4 and 1). Finally, the last command, sort -nr, sorts the output by numeric value (-n) and in “reverse” order (-r), which essentially means descending as opposed to the default ascending order.
Closing Remarks
I hope that this guide provided some helpful tips and tricks for those getting started with Wireshark and/or TShark, and equally important, sparked ideas to take your network-analysis-fu to the next level. If you find yourself overwhelmed while analyzing network traffic, it’s okay, this is normal. Keep in mind that tools aid our analysis, but they are not perfect, no tool is.
We also need to have a sound understanding of what we are analyzing. So, start with a common network protocol, such as DNS or HTTP, and learn as much as possible – this will enhance your ability to distinguish between benign and malicious traffic in your environment.
References
[1] https://www.discovery.com/shark-week
[2] https://www.cisa.gov/sites/default/files/202302/time_guidance_network_operators_cios_cisos_508.pdf
[3] https://tf.nist.gov/tf-cgi/servers.cgi
[4] https://www.wireshark.org/tools/oui-lookup
[5] https://www.wireshark.org/docs/man-pages/tshark.html
*Psst* If you liked this blog, we think you’d enjoy Troy’s class:
Network Forensics and Incident Response
Available live/virtual and on-demand!